

Early 2023 markets look much different from last year
The first quarter of 2023 was an almost complete reversal from the first quarter of 2022. Stocks and bonds finished the quarter higher than they started the year, unlike 2022 when both sold off over 4.5% in the first three months of the year. Inflation is declining instead of rising, and while the Fed raised rates 25 basis points in March, this latest hike may be one of the last increases in the tightening cycle, whereas the 25-basis-point increase in March of last year was the first of seven increases in 2022 for a total increase of 4.25%.
While much has changed, much also remains the same. Unemployment is still low, consumer spending is holding up, economic growth finished the prior year on a positive note and inflation remains above the Fed’s target. While there is plenty of year left, there are a few takeaways from the first quarter that will help determine the direction of the economy and markets.
Economic activity, labor market both look strong
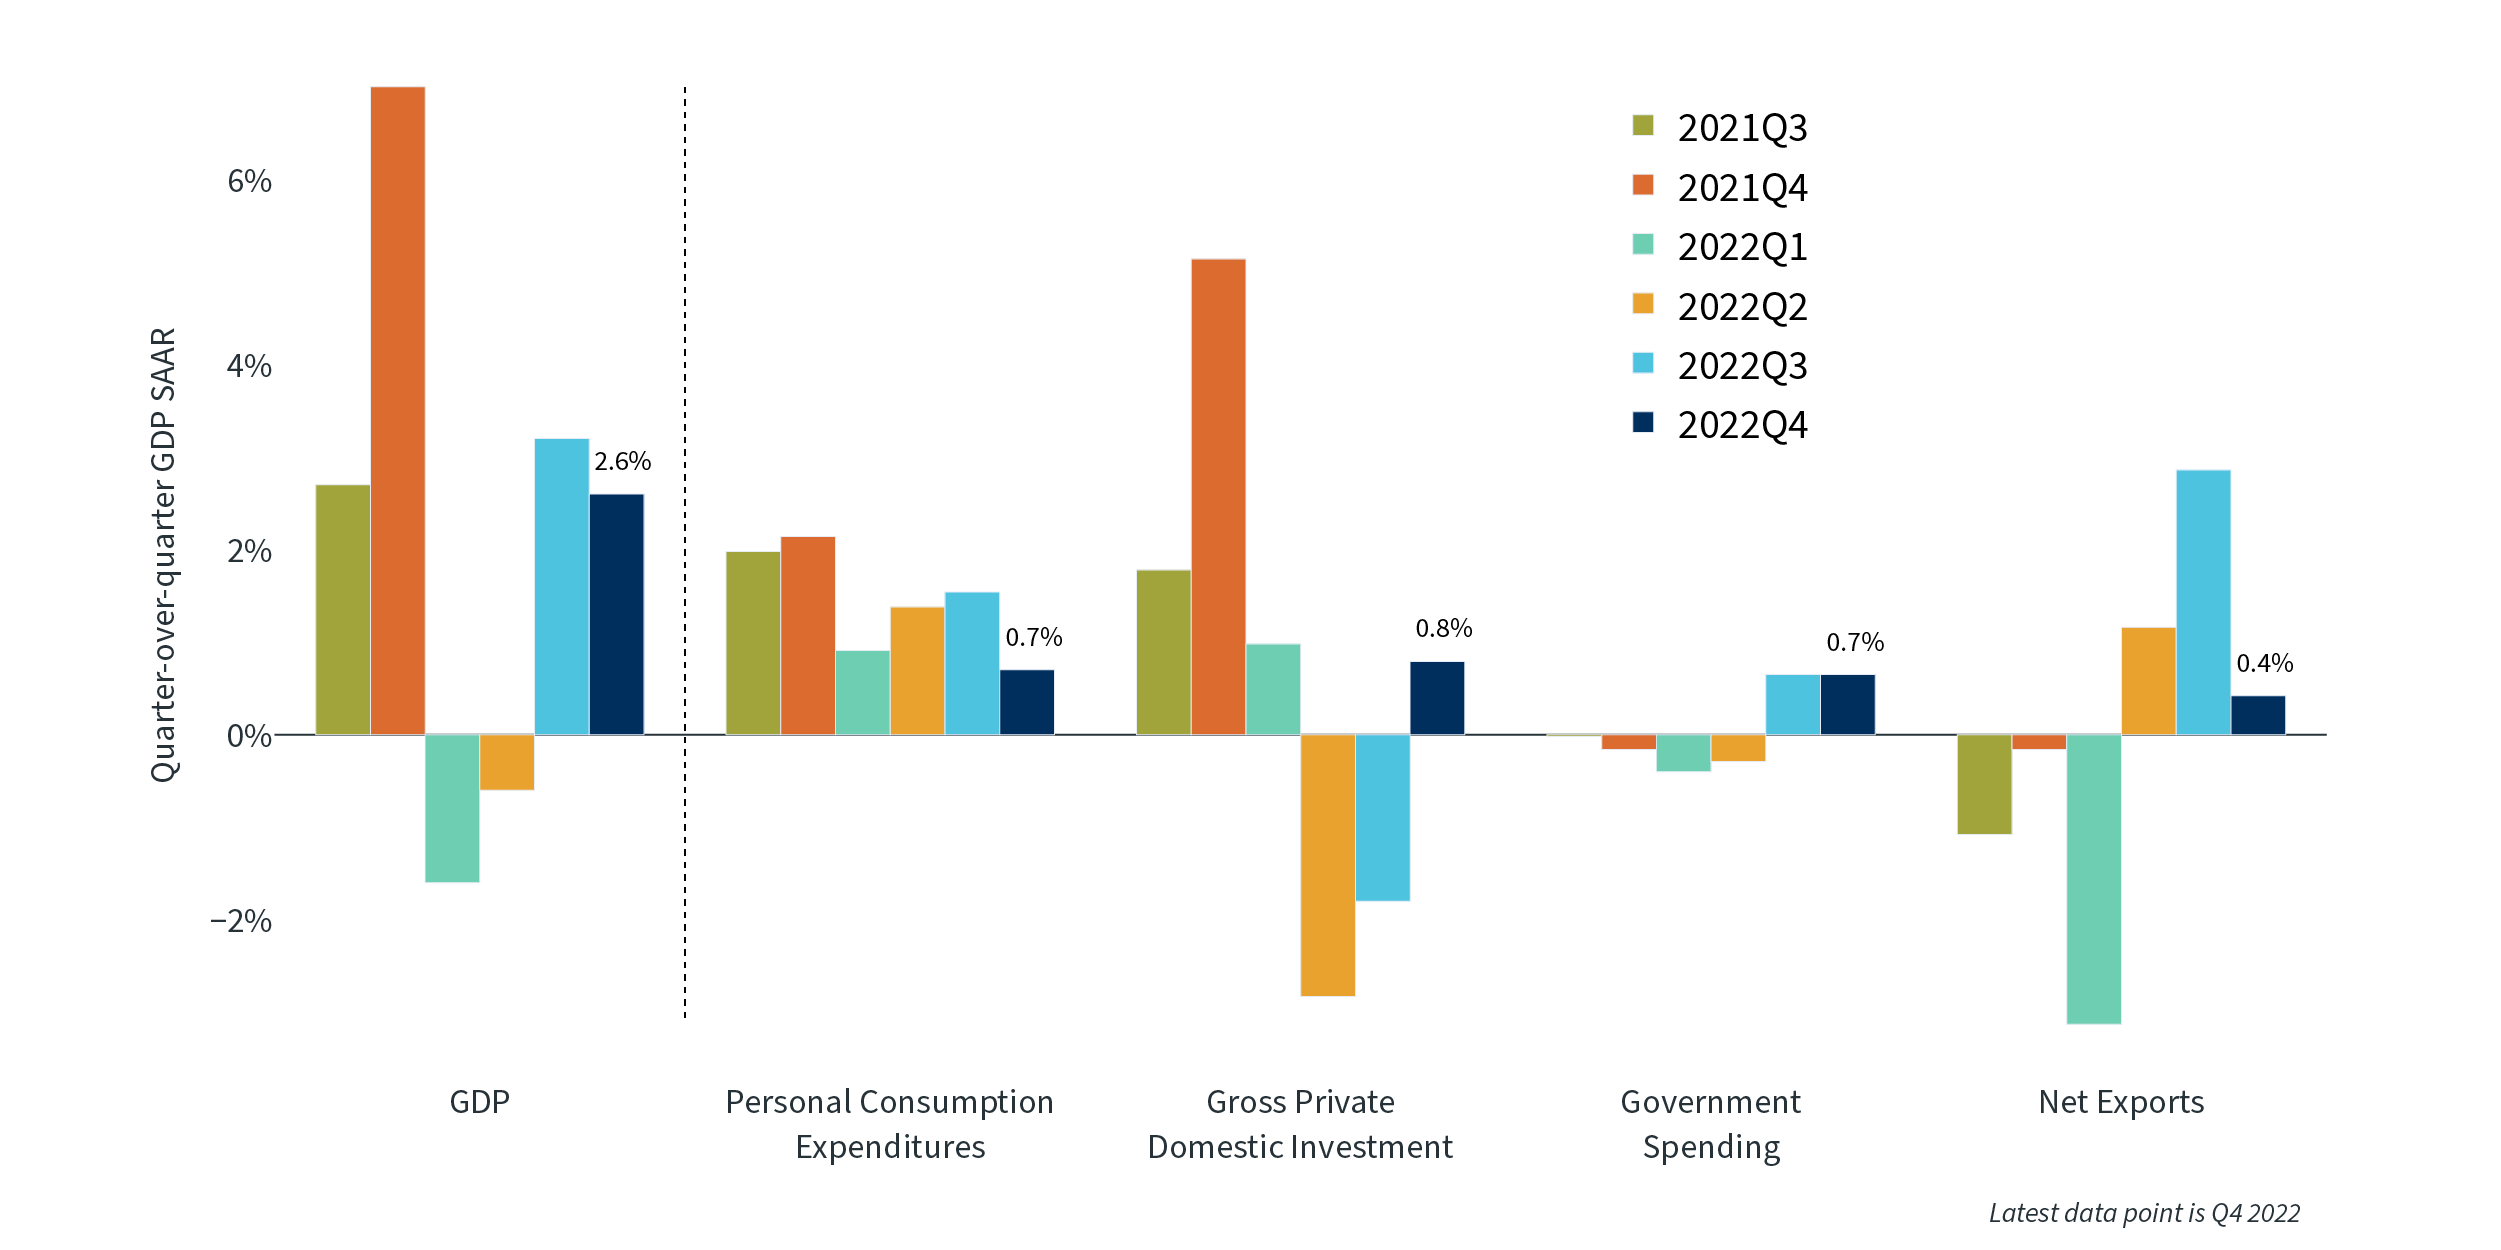
After solid economic growth in 2021, the economy experienced two straight quarters of negative growth to start the year in 2022. This period was affected by some unusual items, and most other measures of economic growth, such as consumer spending and unemployment, remained strong. The GDP reports for the rest of 2022 were solid, rising over 2.5% in both the third and fourth quarters. While data for the first quarter of 2023 hasn’t been released yet, it looks like economic growth will dip only slightly from the fourth quarter of 2022, remaining well above 2%. The economy does appear to be slowing as consumers pull back, corporate earnings growth slows and government deficits decline, but most measures of economic activity remain positive.
GDP Growth Components Over Time1
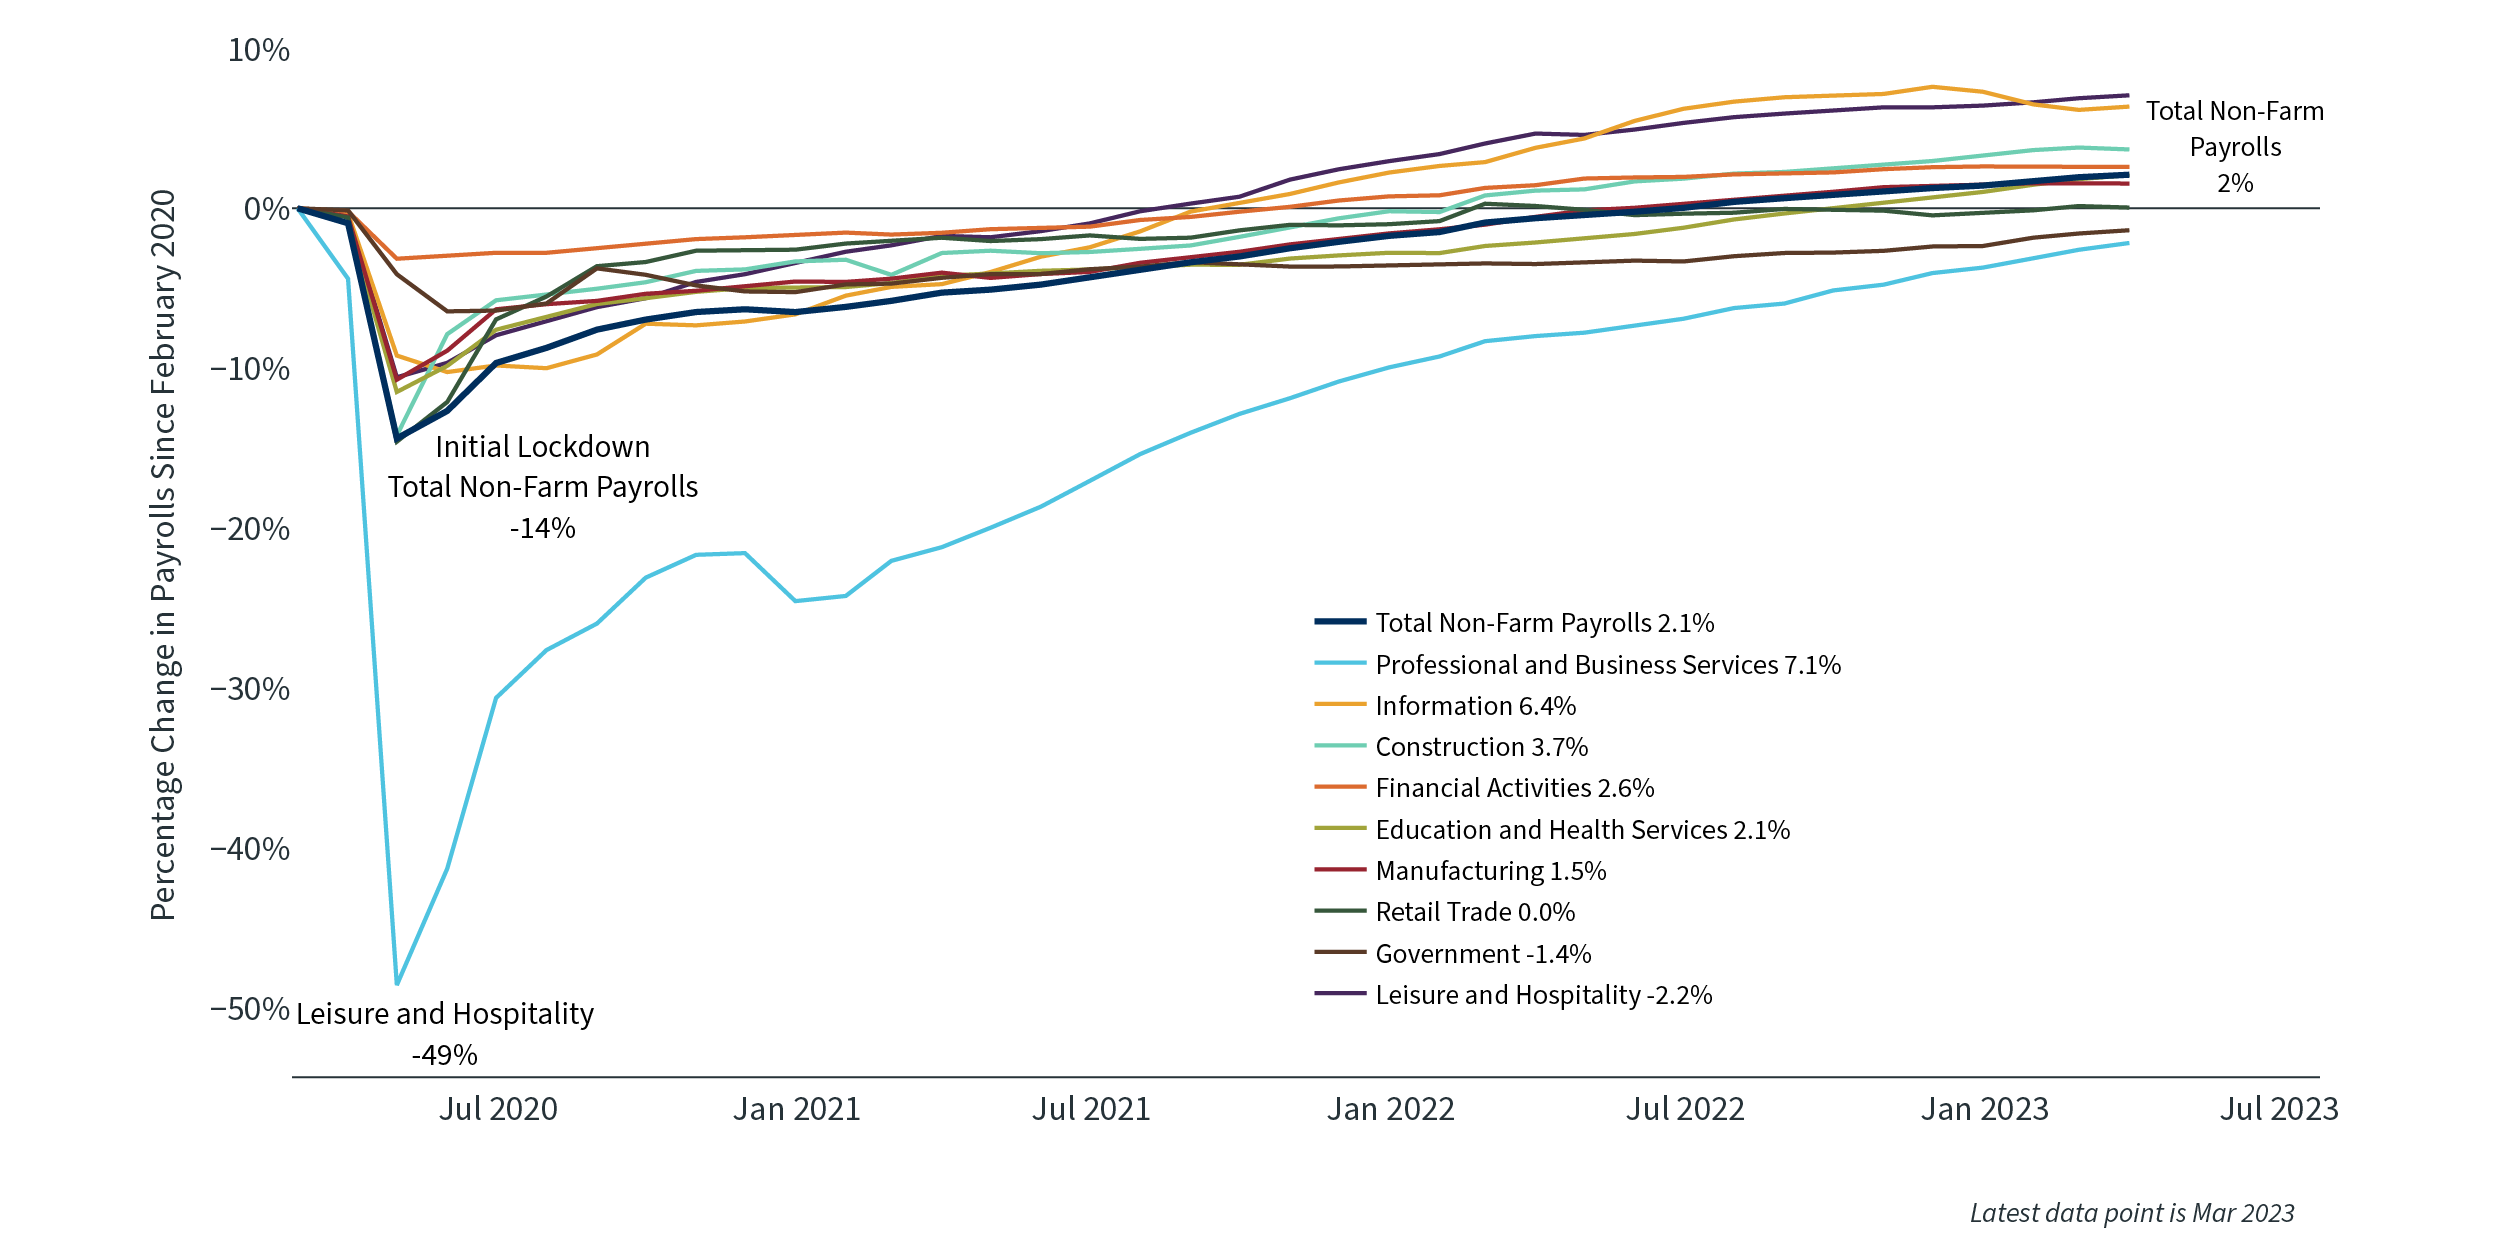
While GDP growth may dip below zero for a quarter or two late in 2023, the labor market is still very strong, even if it has come off its peak. Job openings still outnumber job seekers by a wide margin. Some industries, such as technology, have been laying off workers at a higher rate over the last few months, but other industries, such as hospitality, still have fewer workers than before the COVID-19 pandemic and are struggling to fill roles. Wage growth remains solid, though it is also a bit weaker than it was at the end of 2022. If employment data and wage growth continue to soften but remain healthy, this should help give the Fed confidence it can slow down its rate hikes, and possibly even stop in the near future, as long as inflation continues to fall.
Job Gains by Sector Since 20202
Inflation down from last year
In March of 2022, the Federal Reserve raised the federal funds rate for the first time since before the COVID-19 pandemic. Inflation at the time was 8.5% and rising, a clear indicator that the Fed was behind the curve in containing price increases. The Fed only raised rates by 25 basis points, but at their next meeting they raised rates 50 basis points before starting a series of four straight 75-basis-point increases.
The inflation scenario is very different now. The most recent consumer price index (CPI) reading was 5%, falling for the ninth month in a row. It is still well above the threshold the Fed would like to see, but it does seem that the interest rate hikes of the past year are having the desired effect. As a result, the Fed has raised rates only 25 basis points at each of the first two meetings in 2023 and appears set to raise them by at most 25 basis points at their next meeting in May.
Financial conditions may or may not tighten, depending on market reactions to the Silicon Valley Bank and Signature Bank news. Unlike the savings and loan crisis of the 1980s, when thousands of financial institutions failed, or the financial crisis of 2007-2008, which caused a severe recession, this episode appears to be well contained to just a few banks that made poor decisions on interest rate risk. Most banks remain well capitalized with few problematic loans. While the banking system as a whole is “sound and resilient” according to the Fed, the scars from this episode may cause some tightening of lending standards. This may contribute to a slowing economy and help reduce the need for the Fed to raise rates as high as they might otherwise have done.
Yield curve shows volatility
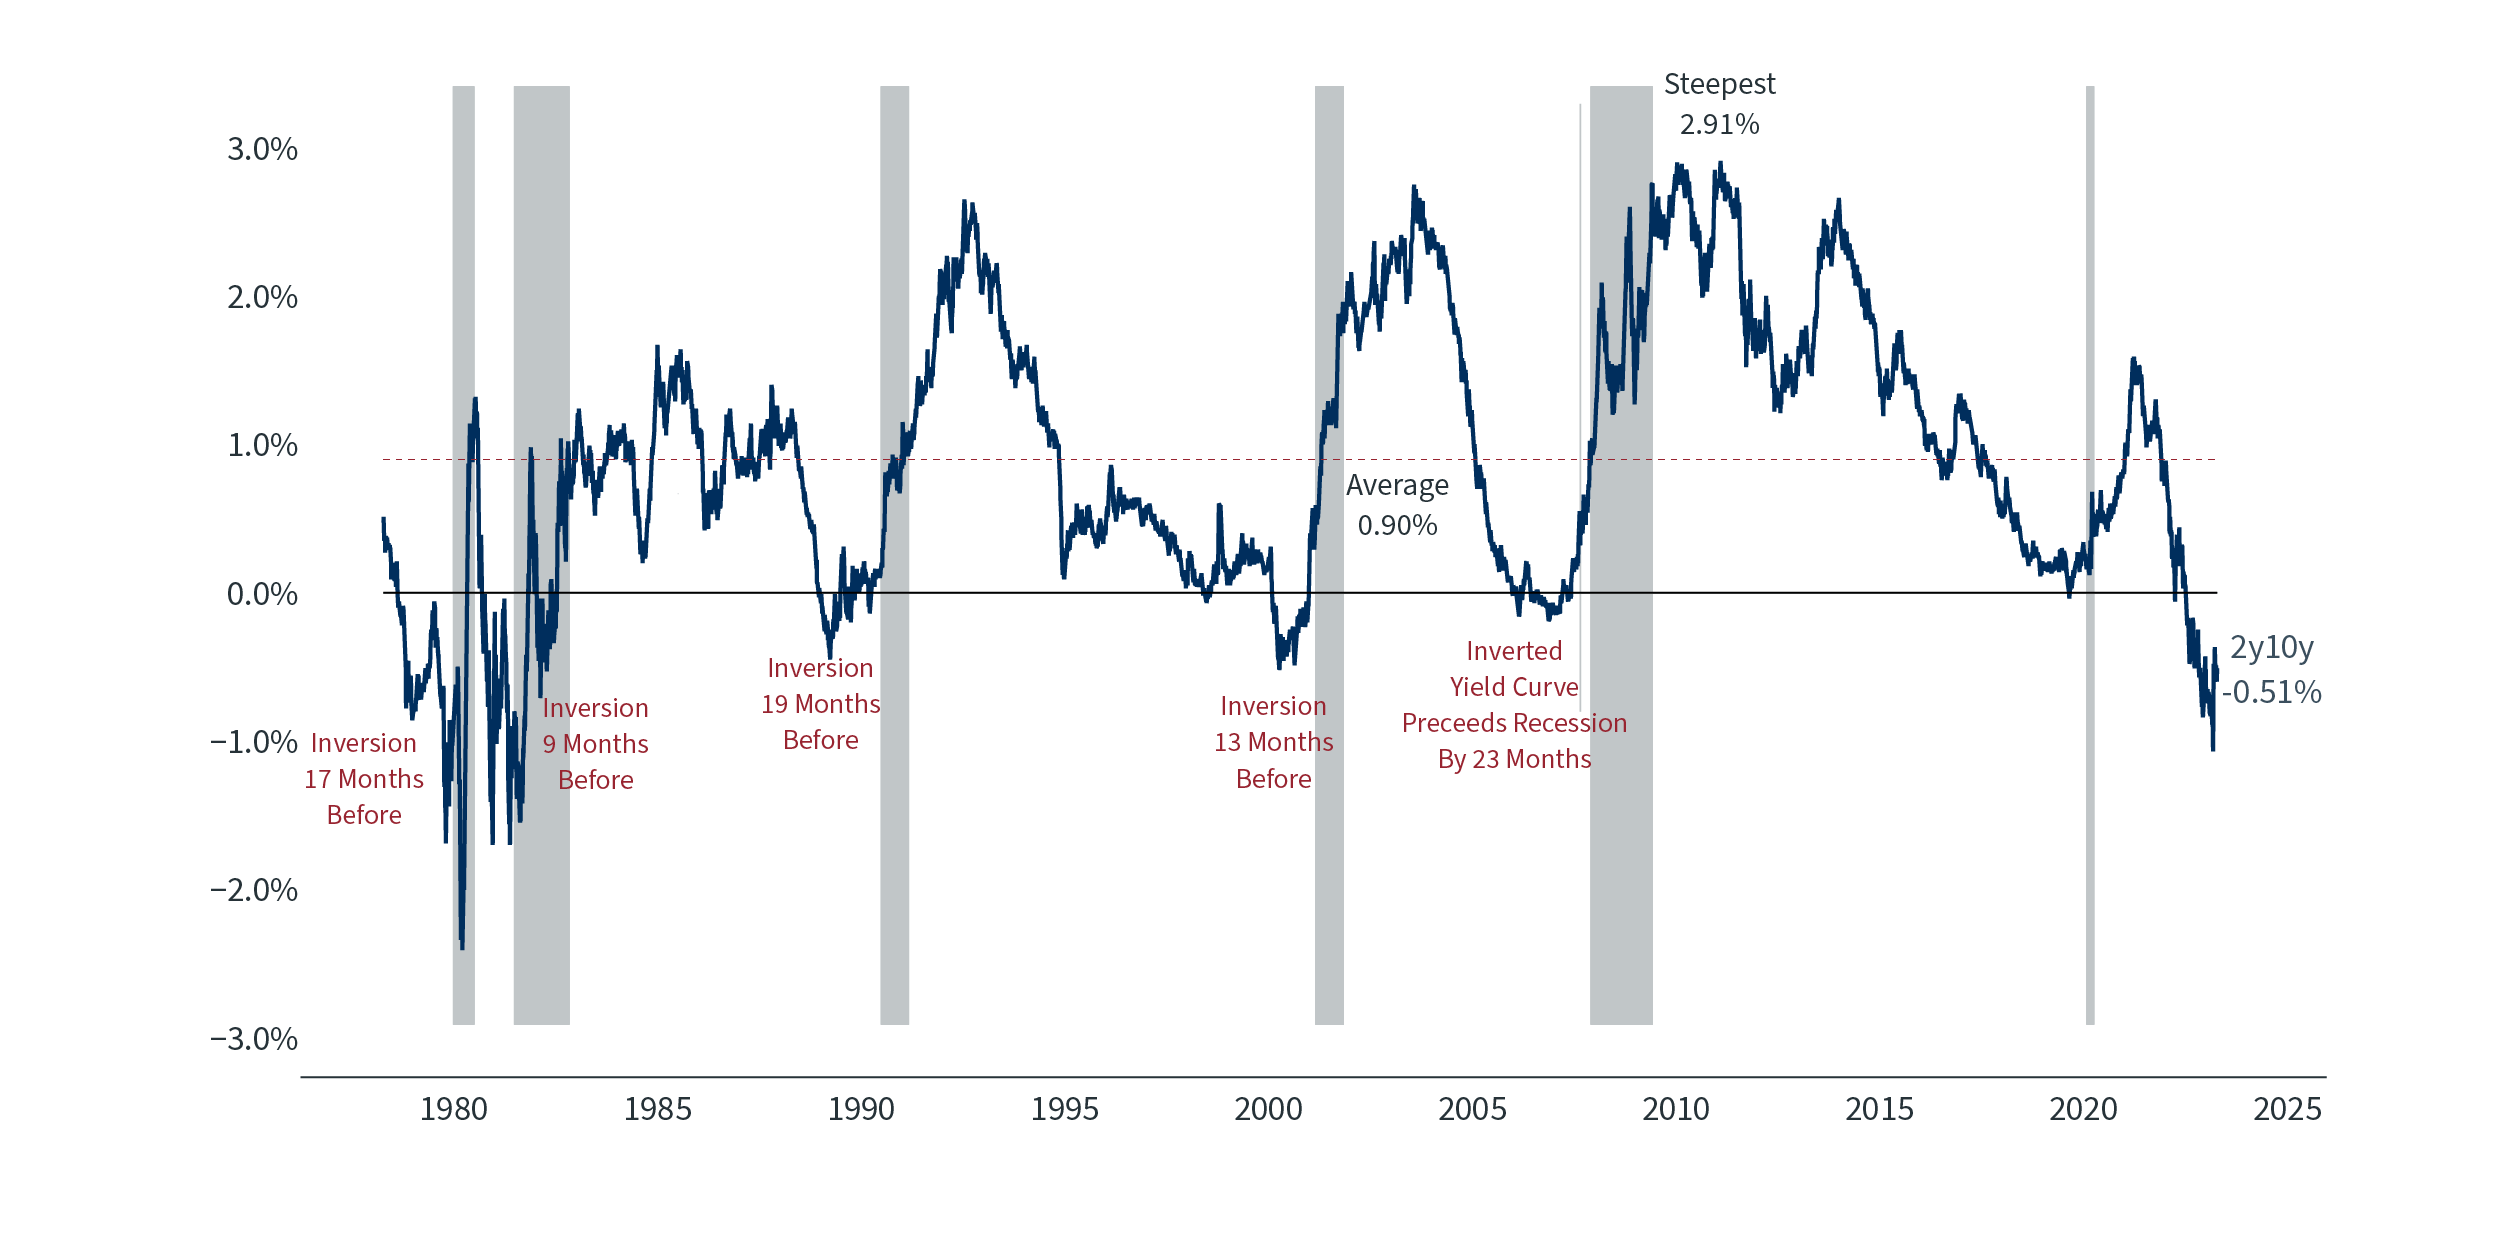
Due to uncertainty around how much more rates will rise, bonds were extremely volatile during the quarter, though it is hard to tell just by looking at the starting and ending yields on Treasuries. On December 31 of last year, the two-year Treasury yield was 4.42% and the 10-year yield was 3.88%. On March 31, the two-year yield was at 4.03% and the 10-year yield was at 3.47%. Those modest declines mask considerable volatility during the quarter, with rates rising and falling by large amounts, both in a given day and over many weeks.
Yields moved higher for the first couple months of the year. By early March, the 10-year Treasury was trading with a yield above 4% and the two-year was above 5%, its highest yield since 2007, extending the inversion of the yield curve to its highest level in decades. When the news of Silicon Valley Bank broke, however, yields fell dramatically. The two-year fell over 100 basis points in just a couple days, its fastest fall of that size in over 40 years. The 10-year sank as low as 3.39% before ending the quarter at 3.47%. This reduced the inversion of the yield curve when measured from two-year to 10-year, but the three-month to 10-year spread is still over 150 basis points, an extreme level.
Yield Curve Steepness3
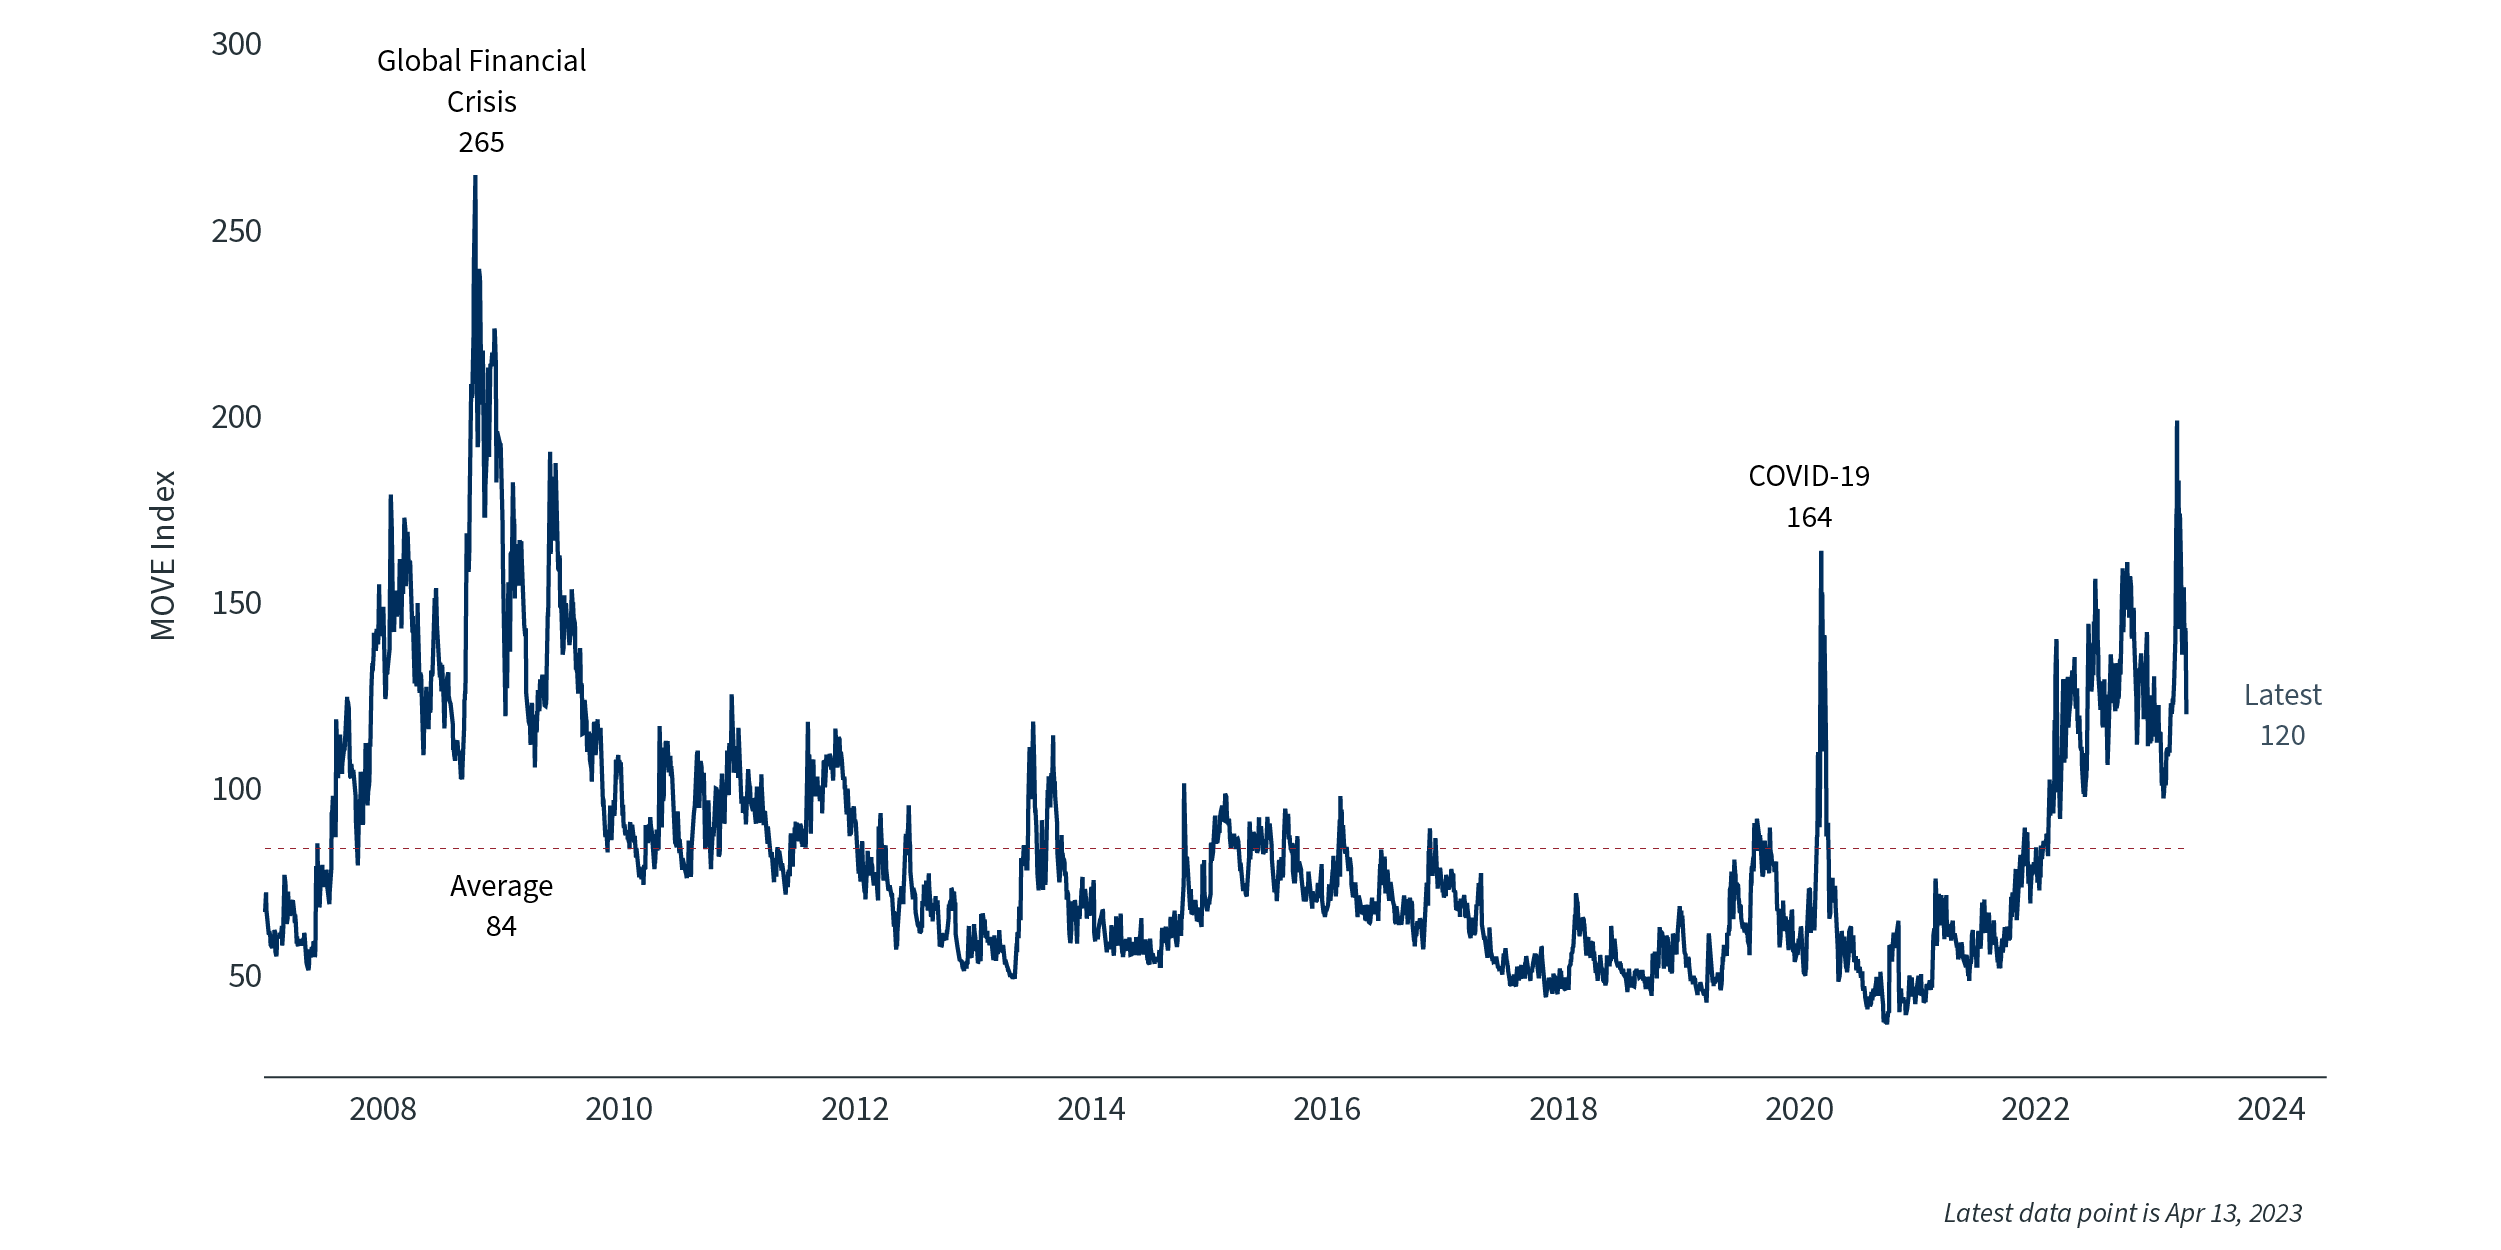
This movement in yields caused bond volatility to rise to its highest levels since 2008-2009. Bond volatility is most commonly measured by the MOVE Index, which can be seen in the chart below. It rose throughout 2022, fell a bit to start 2023, then skyrocketed in March to surpass COVID-19 pandemic levels. Volatility started to come down the last couple weeks of the quarter and should continue to fall as markets get more clarity on the path of the federal funds rate and the likelihood of a recession in late 2023 or 2024.
Bond Market Volatility4
Market performance trends upward to end quarter
Despite continued increases in interest rates and the news of the failures of Silicon Valley Bank and Signature Bank, the S&P 500 stayed range bound within 5% of 4,000 the entire quarter. The S&P finished the quarter up just over 7%, its second straight quarter of positive returns, and most other equity indices ended the quarter on a positive note.
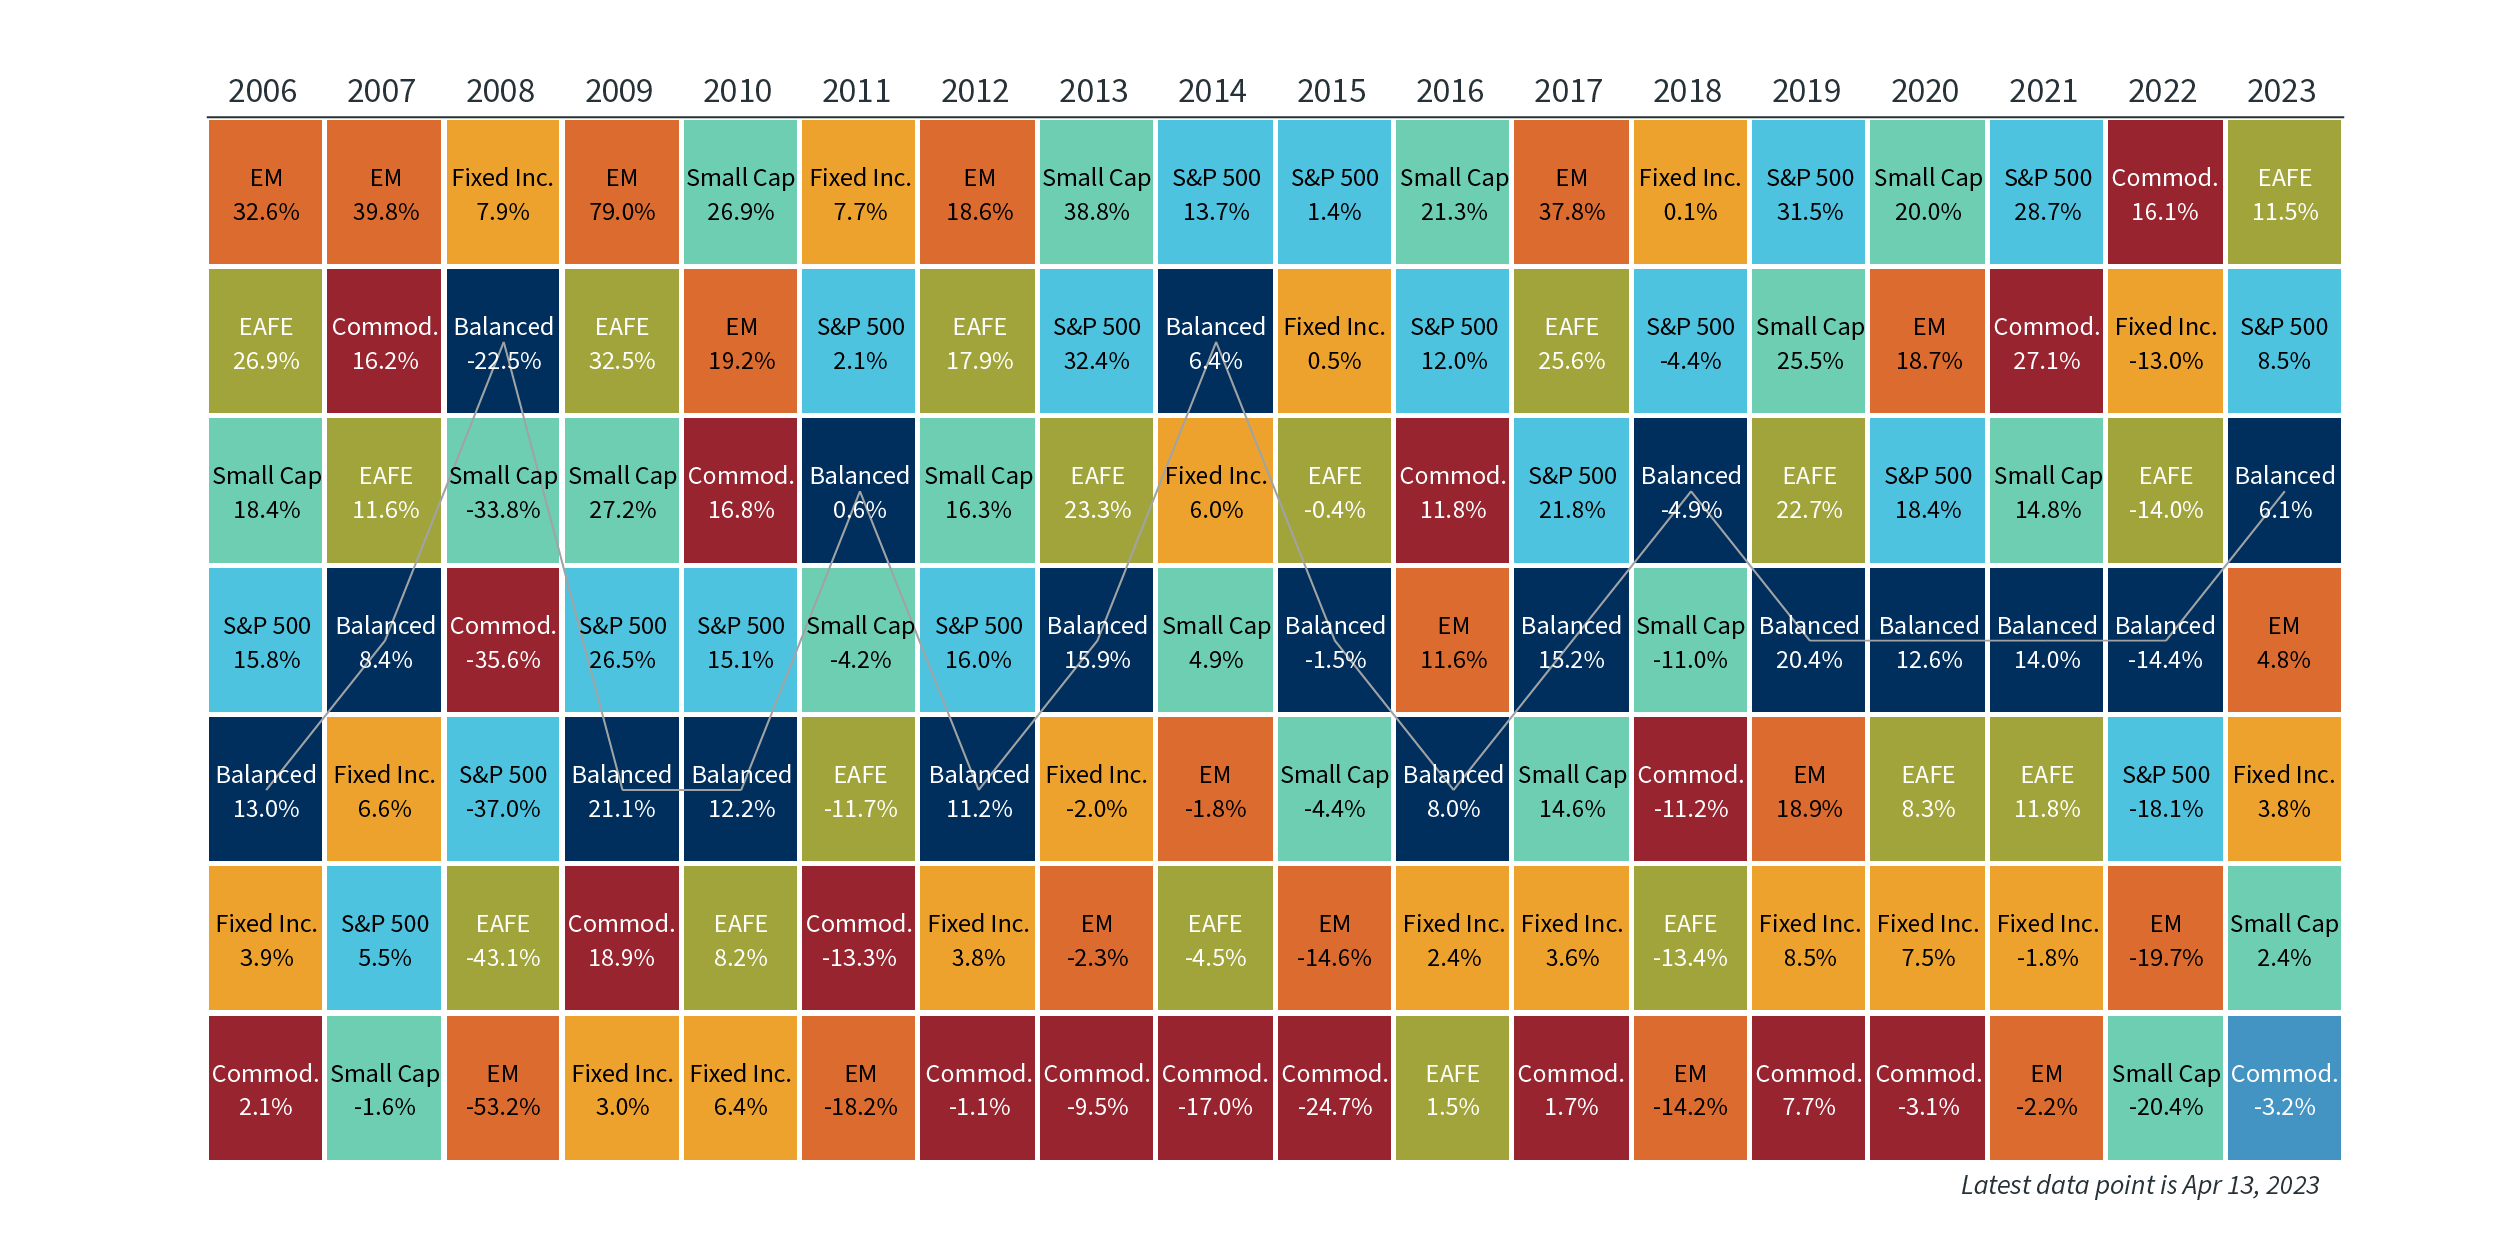
Not only are stocks up this year, reversing some of last year’s negative returns, what trailed last year is winning this year, and vice versa. The sectors that did the best last year, such as energy and utilities, have trailed the market, while tech stocks, which lagged badly in 2022, have been leading the market. Commodities, which were a bright spot last year, have been one of the poorer performing asset classes so far this year, and cash, which has been largely ignored for a decade due to its near-zero return, is now paying rates at or above long-term Treasuries.
Asset Class Performance5
How to stay the course the rest of 2023
The returns on investable assets looked very different in the first quarter of 2023 than they did in 2022. Volatility has not subsided, and it is as difficult as ever to forecast the path of interest rates, inflation or economic growth. There was no knowing in early 2022 how long the war in Ukraine would last, nor was it easy to predict how high the Fed would raise rates in just one year.
This first quarter was marked by sharp reversals and volatility, but ultimately there were higher returns on most assets. This only reinforces that markets are hard to predict, can change quickly, and are affected by events that are outside the control of policy makers and regulators. While in some ways markets and the economy look very different than a year ago, the advice on how to navigate them remains the same – stay invested in a diversified portfolio that matches your risk tolerance. Following this approach is one of the best ways to build wealth, as it helps prevent an investor from missing out on the best days in the market or having too much wealth in one industry or asset class that suddenly underperforms.
“GDP Growth Components Over Time. Quarterly GDP growth rate (SAAR) and contributions over the prior 4 quarters” Sources: Clearnomics, U.S. BEA
“Job Gains by Sector Since 2020. Percentage change in payrolls, select sectors since February 2020 peak” Sources: Clearnomics, Bureau of Labor Statistics
“Yield Curve Steepness. 10-year minus 2-year yields. Recessions are shaded” Sources: Clearnomics, Federal Reserve, NBER
“Bond Market Volatility. ICE BofAML MOVE Index since 2007” Sources: Clearnomics, Intercontinental Exchange
“Asset Class Performance. Total Returns” Sources: Clearnomics, Refinitiv
%20--%3e%3cg%3e%3cg%20id='Layer_1'%3e%3cpath%20class='cls-1'%20d='M63,35.91c.05,14.91-12.02,27.03-26.99,27.12-14.79.09-26.95-12.03-27.01-26.91-.06-15.01,11.91-27.11,26.87-27.16,14.95-.05,27.08,12,27.13,26.95ZM45.08,18.32c-2.37,0-4.6-.07-6.82.02-3.32.14-5.55,1.94-6.61,5-.51,1.46-.62,3.07-.75,4.63-.12,1.45-.03,2.91-.03,4.54h-6.14v6.98h6.16v16.82h7.5v-16.89c1.6,0,2.98.05,4.34-.03.4-.02,1.05-.36,1.11-.65.4-2.02.67-4.06,1.01-6.3h-6.51c0-1.55,0-2.92,0-4.29,0-2.53,1.12-3.72,3.67-3.83,1-.05,2,0,3.06,0v-5.97Z'/%3e%3c/g%3e%3c/g%3e%3c/svg%3e)
%20--%3e%3cg%3e%3cg%20id='Layer_1'%3e%3cpath%20class='cls-1'%20d='M63,36.15c-.07,14.97-12.18,26.99-27.11,26.89-14.9-.1-26.92-12.16-26.89-26.99.03-15.01,12.15-27.11,27.15-27.08,14.87.03,26.92,12.23,26.85,27.18ZM36.62,51c.03-.53.08-.98.08-1.42,0-3.11-.04-6.22.02-9.33.05-2.49,1.88-4.31,4.23-4.36,2.31-.05,3.92,1.63,4,4.27.06,1.88.02,3.77.02,5.66,0,1.72,0,3.43,0,5.17h6.01c0-5.04.18-9.98-.07-14.91-.16-3.17-3.26-5.57-6.55-5.78-2.85-.18-5.44.35-7.56,2.83-.08-1.07-.14-1.75-.19-2.46h-5.83v20.33h5.84ZM27.06,30.66h-5.99v20.32h5.99v-20.32ZM24.06,20.18c-2.03-.03-3.64,1.57-3.66,3.65-.02,2.14,1.45,3.73,3.52,3.78,2,.05,3.74-1.57,3.82-3.56.08-2.04-1.63-3.84-3.68-3.87Z'/%3e%3c/g%3e%3c/g%3e%3c/svg%3e)
%20--%3e%3cg%3e%3cg%20id='Layer_1'%3e%3cg%3e%3cpath%20class='cls-1'%20d='M35.95,9.01c14.89-.05,27.01,12,27.05,26.9.04,14.88-12.08,27.09-26.9,27.08-14.88,0-27.08-12.13-27.1-26.93-.02-14.85,12.08-27,26.95-27.05ZM36.02,18.76c-2.54,0-5.09-.01-7.63,0-5.58.03-9.63,4.08-9.65,9.64-.01,5.09-.02,10.18,0,15.27.02,5.3,3.98,9.46,9.28,9.57,5.34.11,10.69.11,16.03,0,5.31-.11,9.22-4.26,9.24-9.58.02-5.19.03-10.38,0-15.57-.04-5.2-4.12-9.25-9.33-9.31-2.65-.03-5.29,0-7.94,0Z'/%3e%3cpath%20class='cls-1'%20d='M50.22,36.02c0,2.54.02,5.09,0,7.63-.03,3.73-2.68,6.49-6.41,6.54-5.19.06-10.37.06-15.56,0-3.7-.04-6.42-2.81-6.45-6.52-.04-5.14-.04-10.27,0-15.41.03-3.64,2.72-6.38,6.36-6.42,5.24-.06,10.48-.06,15.71,0,3.67.04,6.31,2.75,6.35,6.41.03,2.59,0,5.19,0,7.78ZM36.1,26.6c-5.11-.05-9.38,4.12-9.43,9.2-.05,5.28,4.02,9.53,9.18,9.59,5.26.07,9.54-4.07,9.66-9.35.11-5.02-4.25-9.4-9.41-9.44ZM43.25,26.81c.02,1.05,1.05,2.03,2.08,1.99,1.07-.04,2.04-1.06,1.92-2.12-.12-1.15-.78-1.84-1.98-1.87-1.13-.03-2.05.89-2.02,1.99Z'/%3e%3cpath%20class='cls-1'%20d='M42.2,36.07c-.04,3.39-2.95,6.22-6.3,6.13-3.35-.09-6.06-2.89-6.05-6.23,0-3.28,2.86-6.13,6.15-6.14,3.36,0,6.24,2.89,6.2,6.24Z'/%3e%3c/g%3e%3c/g%3e%3c/g%3e%3c/svg%3e)
%20--%3e%3cg%3e%3cg%20id='Layer_1'%3e%3cg%3e%3cpath%20class='cls-1'%20d='M8.99,36.02c0-14.9,12.03-27.02,26.87-27.06,14.99-.03,27.2,12.17,27.15,27.13-.05,14.95-12.18,26.99-27.14,26.94-14.9-.05-26.87-12.08-26.87-27.02ZM36,48.01c4.01-.29,8.03-.5,12.03-.89,2.54-.25,3.77-1.45,4.16-3.94.75-4.76.75-9.54.02-14.3-.39-2.56-1.67-3.79-4.23-4.08-7.98-.91-15.96-.92-23.94,0-2.67.31-4.16,1.68-4.27,4.36-.18,4.57-.17,9.15,0,13.71.1,2.6,1.56,3.98,4.19,4.24,4,.4,8.01.6,12.04.89Z'/%3e%3cpath%20class='cls-1'%20d='M41.32,35.97c-2.91,1.7-5.64,3.29-8.55,4.98v-9.87c2.87,1.64,5.61,3.21,8.55,4.89Z'/%3e%3c/g%3e%3c/g%3e%3c/g%3e%3c/svg%3e)