

Take your financial snapshot before the new year
The fourth quarter of the year is a good time to examine your financial picture and ask a few questions. Which assets have performed well, and which ones have performed poorly? Is your investment portfolio still aligned with your risk tolerance, or does it need to be rebalanced back to the intended targets? Are there charitable giving opportunities to take advantage of before year-end, benefiting both the recipient organization and potentially lowering your taxes? Do you want to make contributions to other tax-advantaged plans like 529s or IRAs?
These are smart questions to ask every year, but particularly in a year like 2023 that has seen some assets soar, some continue to decline and some move around with lots of volatility. For example, the Nasdaq Composite Index was up over 30% in the first six months of the year but sold off in the third quarter. It is still down 15% since the beginning of 2022. If you have exposure to the Nasdaq, you may be sitting on a small short-term loss, a big short-term gain, or a long-term loss, depending on when you purchased the fund. Treasury bonds have sold off for the third year in a row as yields continue to climb. With large-cap equities up for the year and bonds flat or down, many investors may have more exposure to equities than they intended, providing great opportunities for rebalancing back to targets.
How the rest of the year plays out in markets will depend on a myriad of factors, but there are a few data points that will be especially important to watch.
Short-term rates may have peaked, intermediate-term rates continue to rise
During the third quarter, the Federal Reserve raised rates another 25 basis points, taking the federal funds rate to a range of 5.25% to 5.50%, the highest since 2001. The third quarter was the second quarter in a row where the Fed raised rates just one time and by only 25 basis points, a big slowdown from the rapid and large increases we saw last year. They also released a new version of their dot plot, which indicates they expect to raise rates just one time in the fourth quarter as well. While the Fed may cut rates in 2024, current indications are that it won’t be by much and may not happen until later in the year, due to still strong economic growth, robust labor markets and an inflation level that remains above their 2% target.
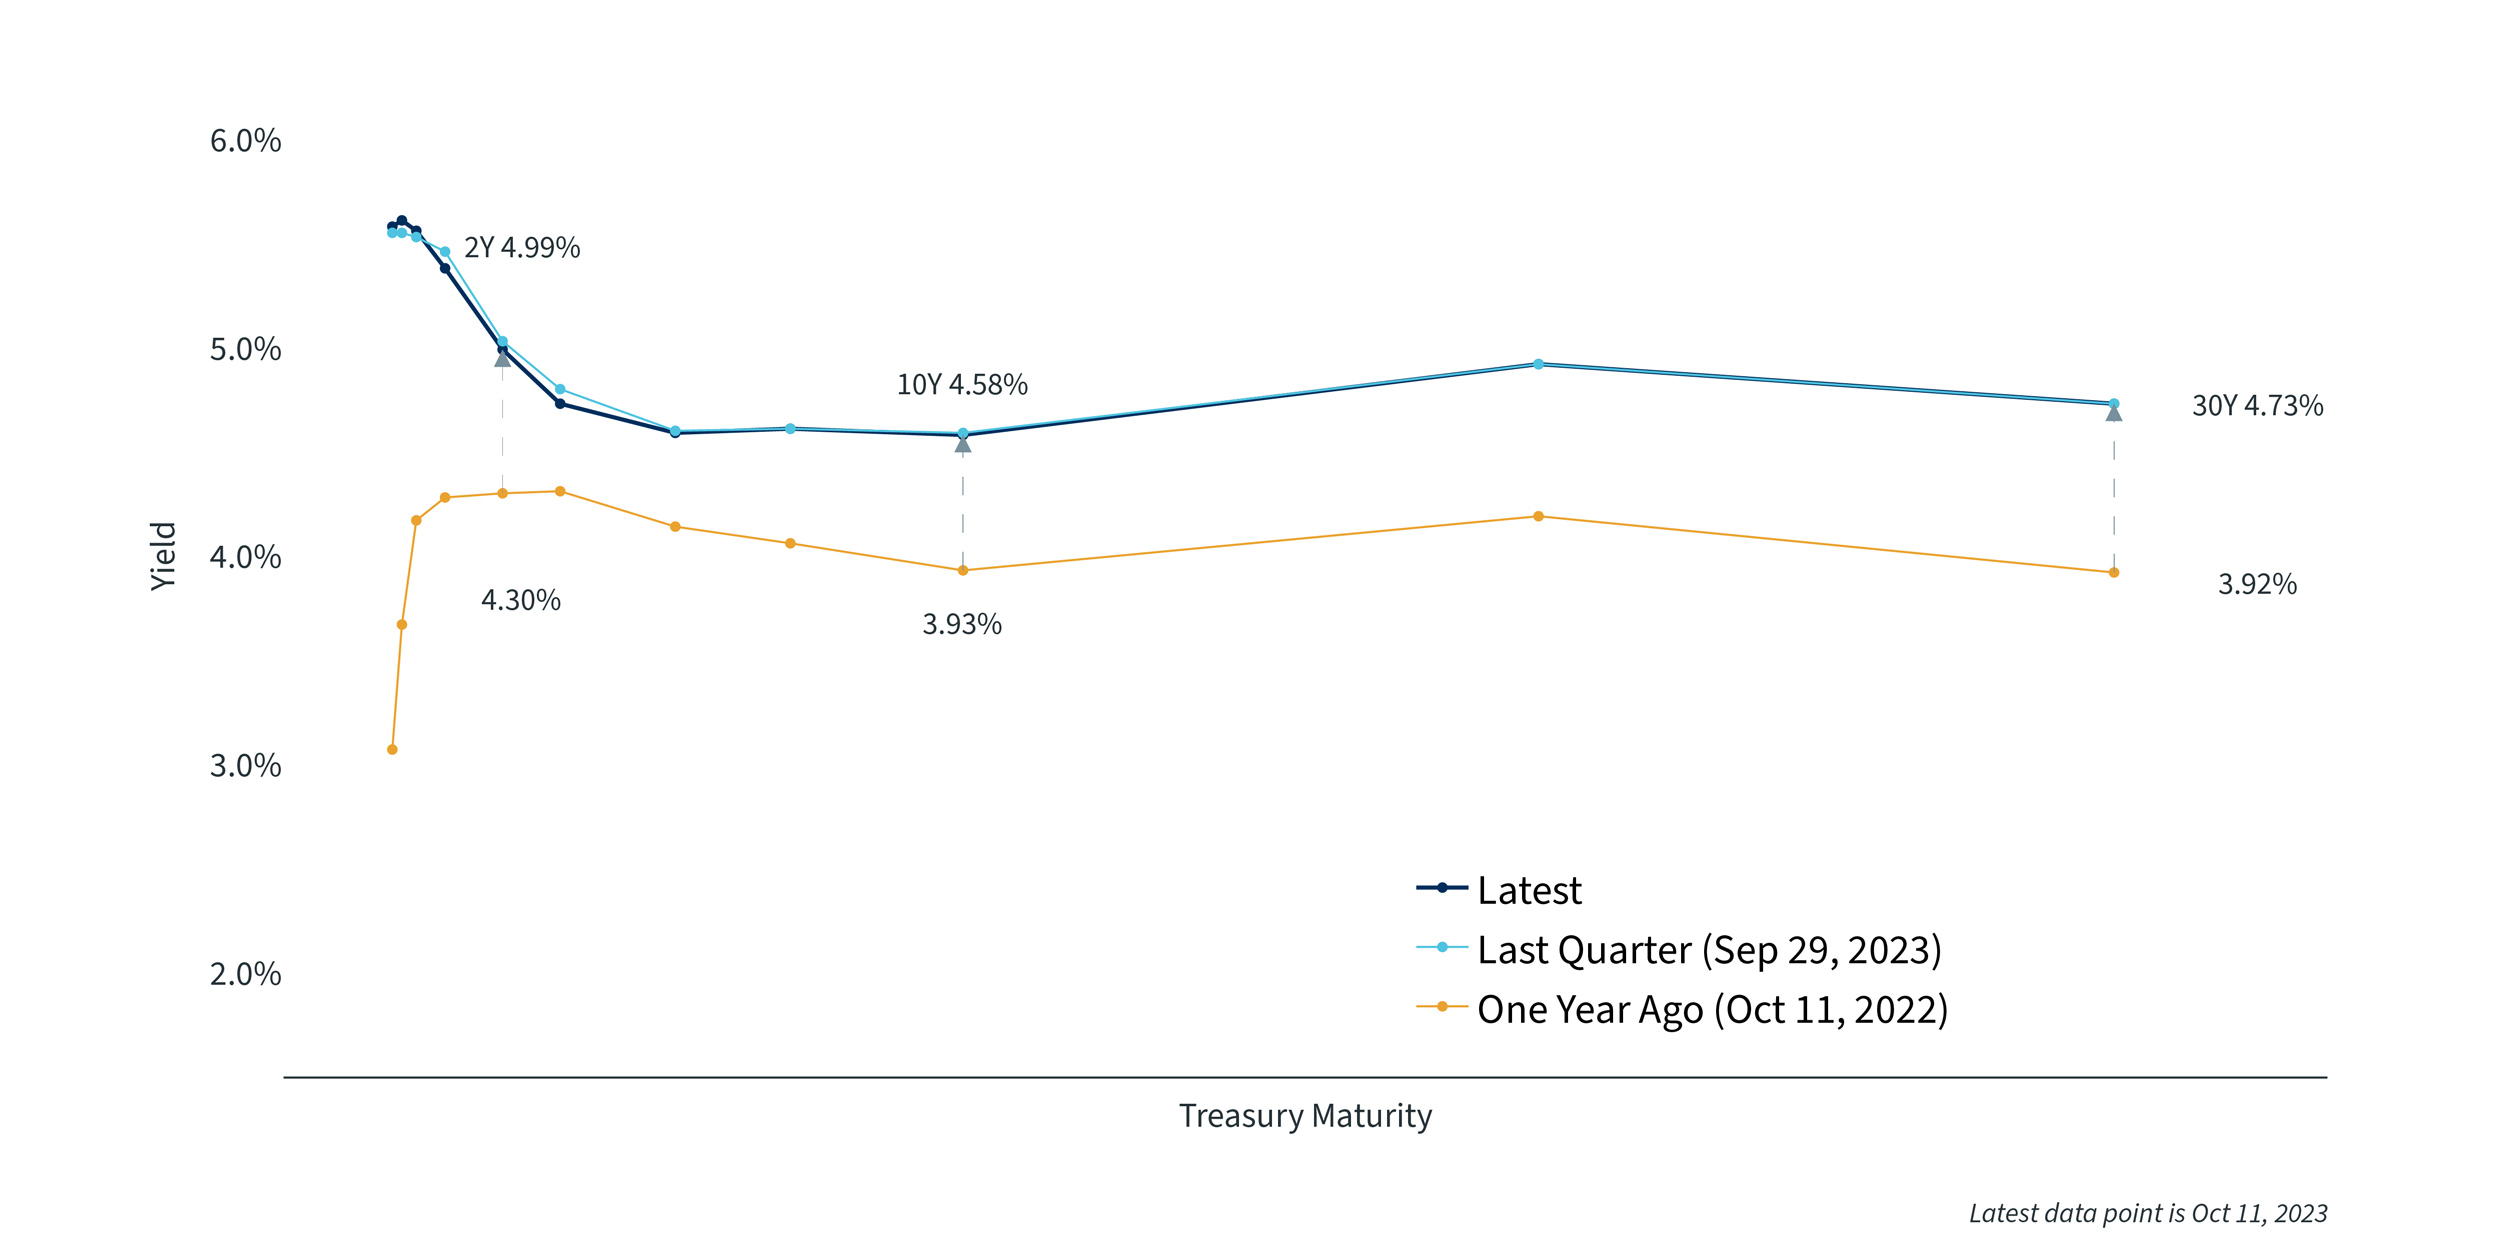
Short-term rates rose only modestly in the quarter and may be near or at their peak for this cycle, but intermediate-term rates rose a lot during the third quarter. The 10-year Treasury ended September at 4.6%, an almost 0.80% increase during the quarter, and the increase in the 10-year rate shows no sign of slowing down. This has reduced the inversion of the yield curve (the difference between short-term rates and longer-term rates) but has increased borrowing costs for consumers and companies, which may impact economic growth as much or more than the current level of short-term rates. Corporate defaults are starting to pick up, including the large July bankruptcy of Yellow Corporation (also known as Yellow trucking), one of the nation’s largest freight carriers. The rising yields have also led to a rebound in the strength of the U.S. dollar. The dollar rose for 11 straight weeks in the third quarter after falling in the first half of the year as U.S. yields became more attractive to foreign investors.
Treasury Yield Curve1
Housing market is slow due to high rates, low inventory
One of the main economic areas affected by the increase in the 10-year yield is the housing market. There is no question that housing plays a large role in the American economy, representing 16% to 18% of GDP and over one-third of the consumer price index. For the vast majority of homebuyers, it is the main asset they borrow to finance, so the health of the housing market is greatly affected by interest rates.
By many measures, housing is doing well. Not unlike the labor market, it is off its peak but is surprisingly resilient after interest rate increases of 5% or more. Prices are at or near records and homes are selling, though spending on home improvement has fallen considerably since the peak of the pandemic, when it soared to all-time highs. The biggest challenges are the rising cost to finance a house and the lack of inventory, especially for existing homes, as homeowners with low-cost mortgages are reluctant to sell. There were fewer than 1 million existing homes for sale nationally during July, the lowest number for the usually strong month since 1982. During the quarter, applications for mortgages to purchase a home dropped to their lowest levels since 1995. The available supply of homes on the market has been slashed in half since July 2019, a huge drop.
While existing home sales are down 17% year-over-year, sales of new homes in July were up more than 31% from a year ago. The U.S. has a shortage of housing, and because there is a limited inventory of existing homes for sale, many buyers have turned to new construction. Residential construction can’t keep up with total new households that have been formed, partly due to a lack of skilled labor as well as the cost of financing, so it will likely remain a tight housing market for some time.
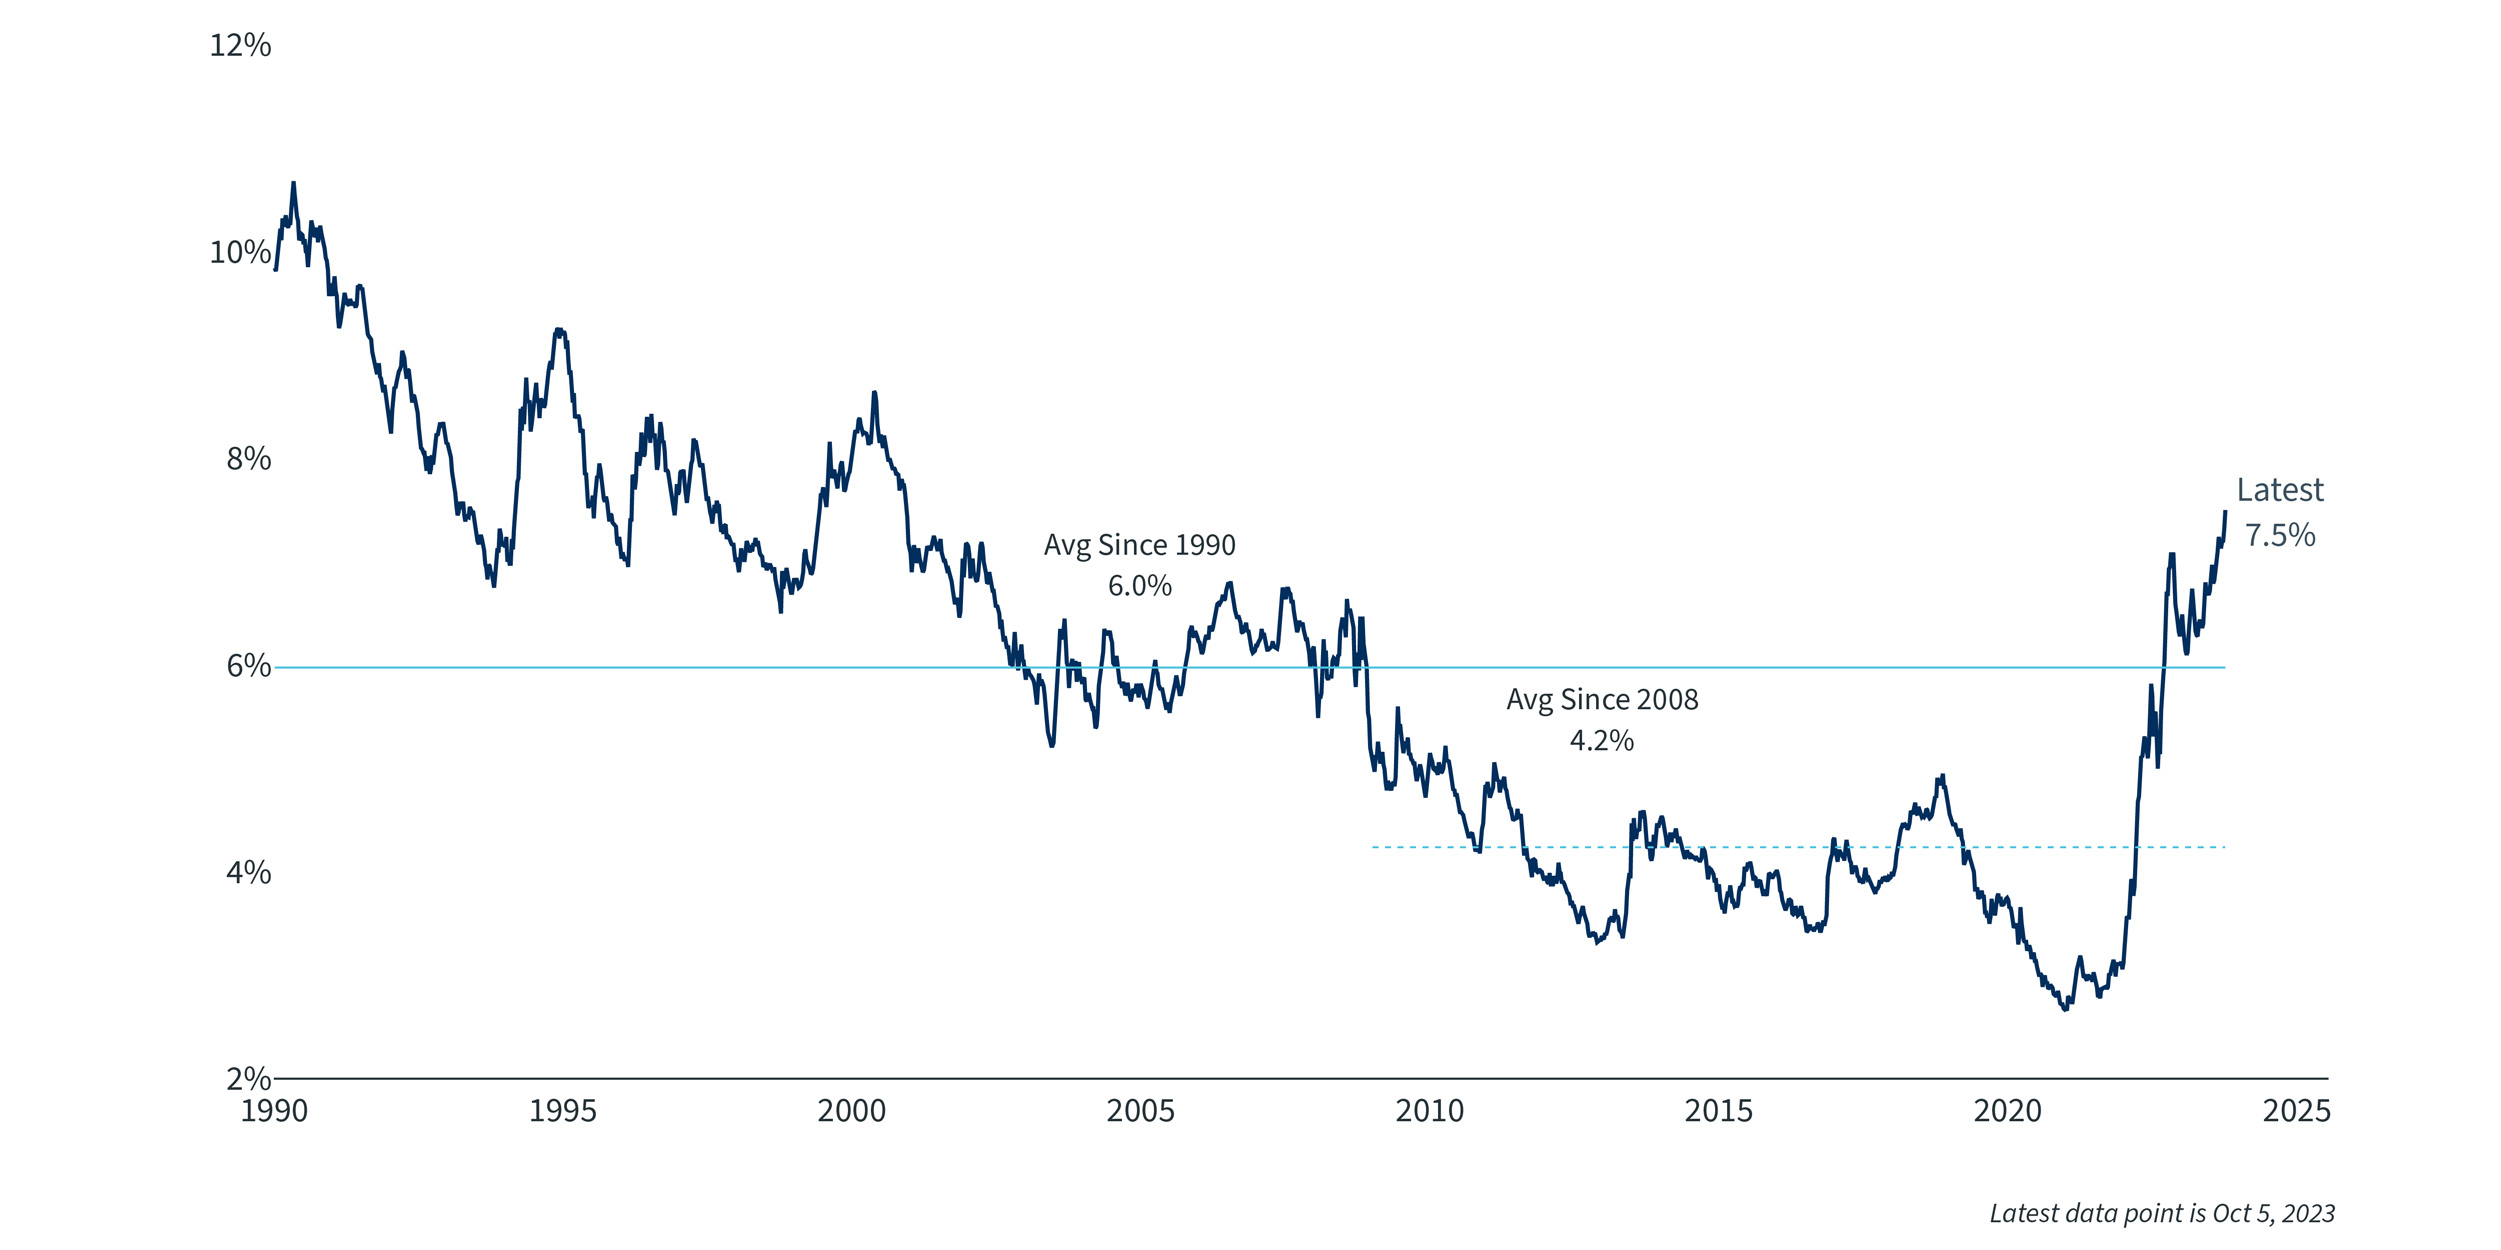
Not only is there a lack of inventory, but housing is also expensive right now as the absolute cost of housing is at all-time highs and the cost to finance a home has risen dramatically. The average 30-year fixed mortgage currently has an interest rate of 7.4%. That is the highest in 20 years and is a drastic change from two years earlier, when borrowing rates were below 3%. It is even a big change from a year ago, when rates were in the 5% to 5.5% range. Affordability is lower than at any time since 1990, as the monthly cost of a median-priced home with a new mortgage will consume over 40% of median household income, almost double the cost in 2019.
Mortgage Rates2
Consumers continue to spend, but sentiment is lower than economic data would suggest
Despite the headwinds from still-elevated inflation, tightening bank lending standards and rising interest rates, consumers continue to spend at levels that seem disconnected from consumer sentiment. Over the past year, consumer sentiment has fallen to very low levels, though it has rebounded a bit the last few months. Sentiment normally tracks with consumer spending, suggesting consumers should be pulling back on spending right now, but that hasn’t occurred. It is odd to see consumer sentiment so low when jobs continue to be plentiful, the unemployment rate remains below 4%, GDP growth is above 2% and wage growth is now above inflation, but sentiment is at levels normally associated with a recession.
Consumer Sentiment3
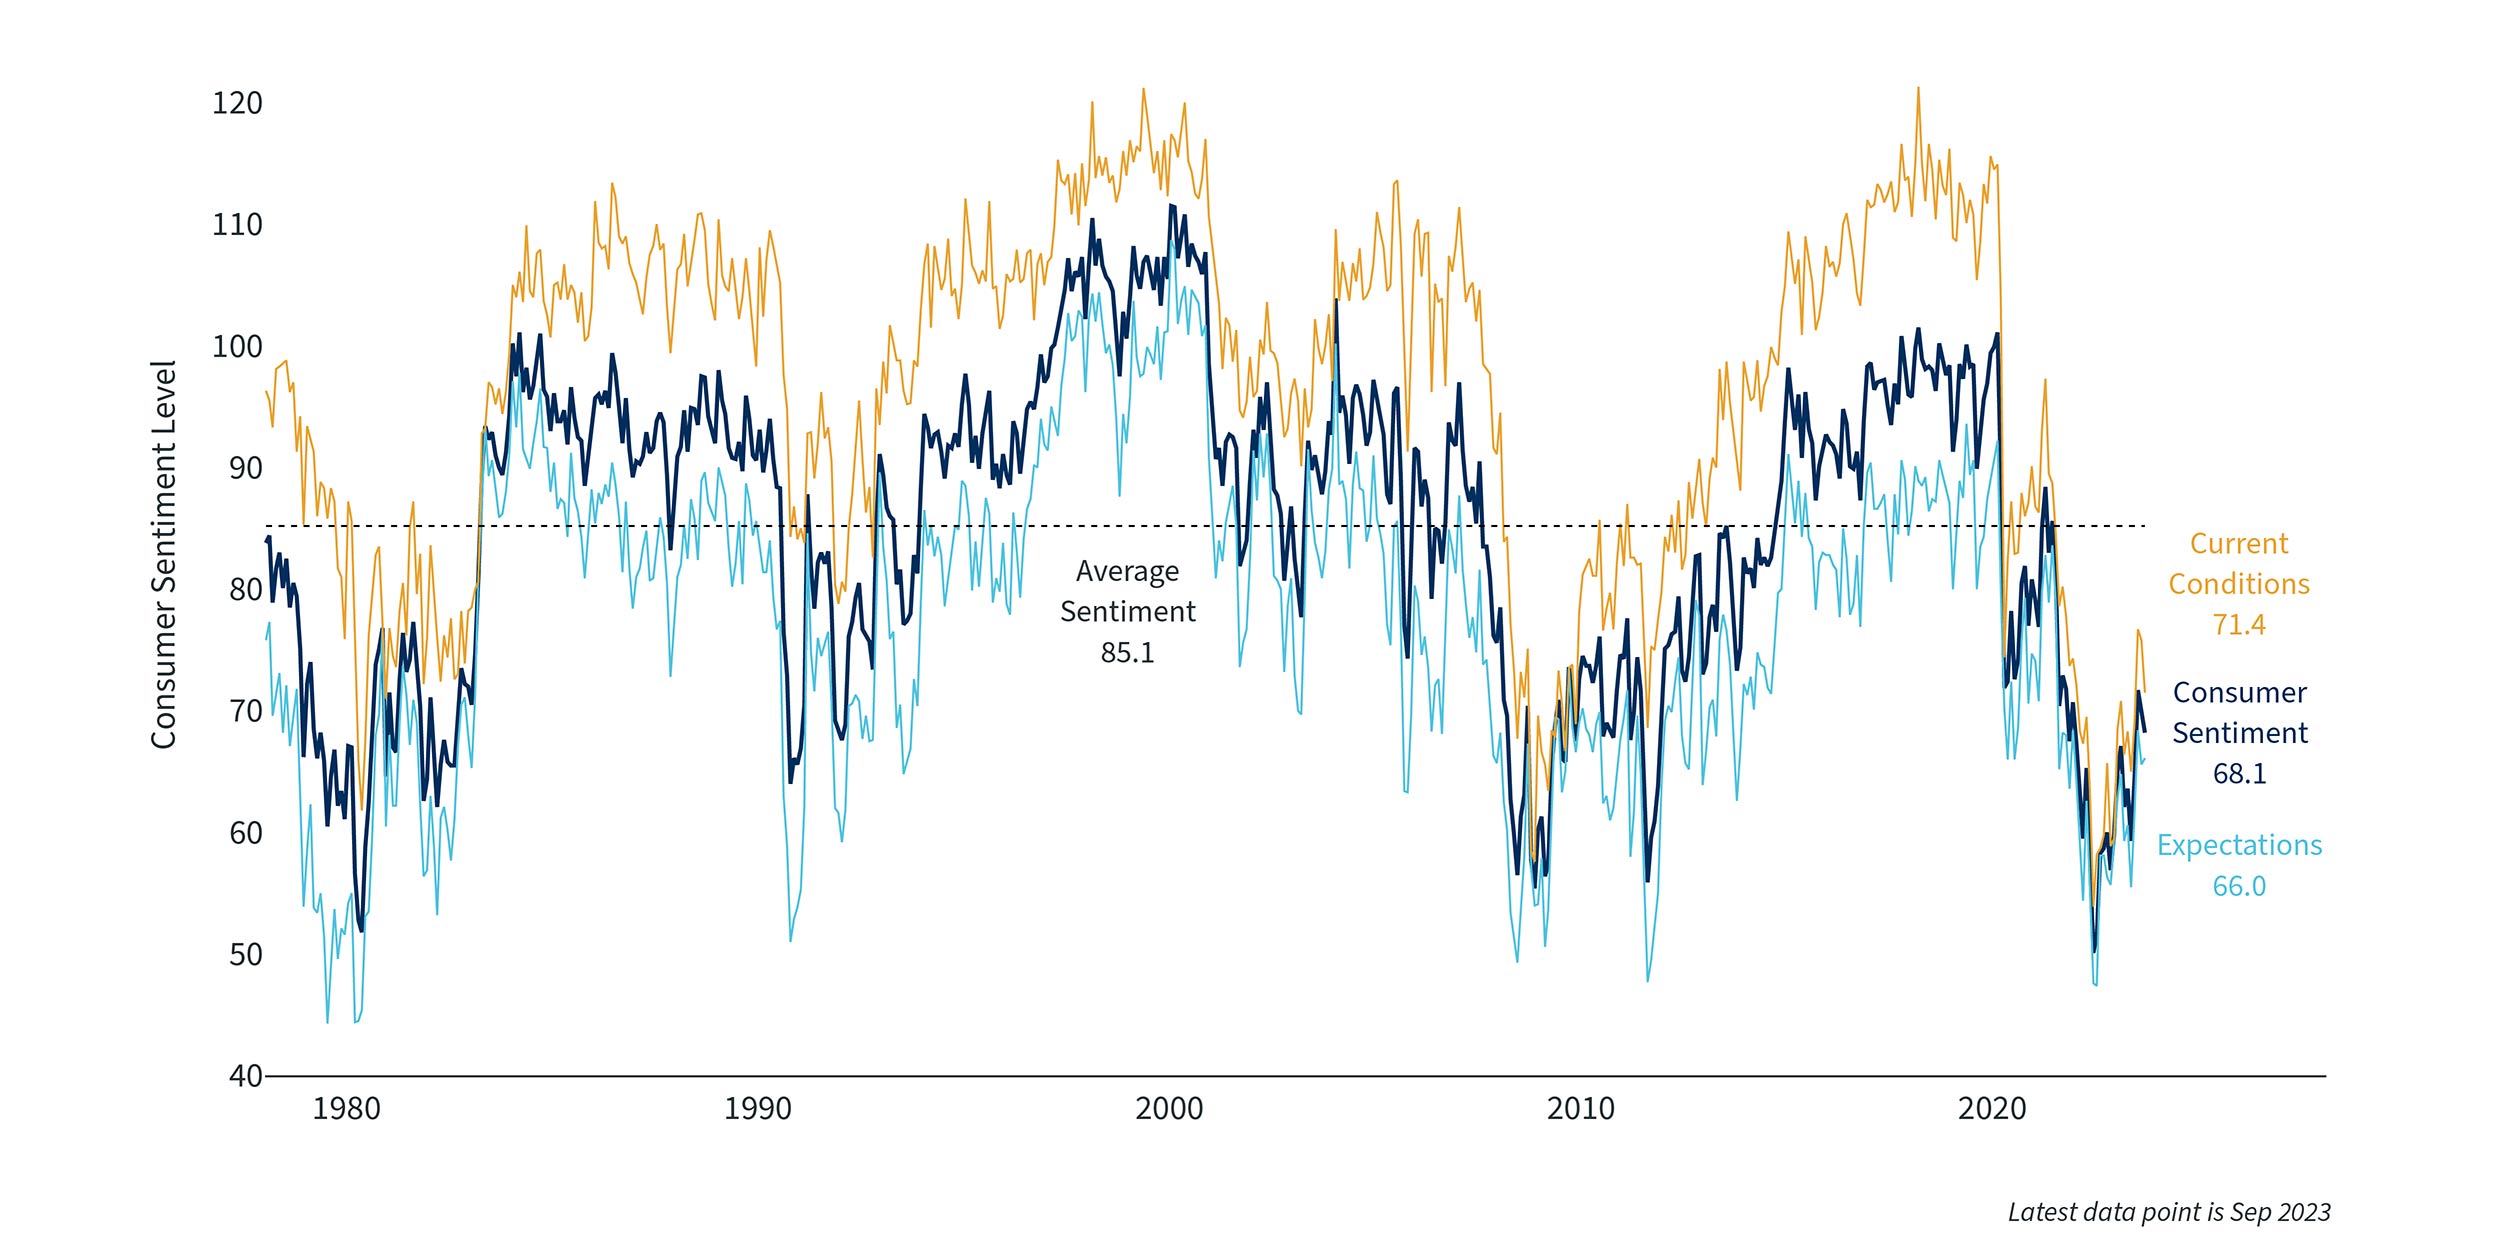
The low levels of consumer sentiment may be driven partly by the high level of inflation the economy has experienced over the past two years. Other driving factors include the reduction in excess savings at people’s disposal and the rapidly rising interest rates associated with the fight to curtail inflation, even though most other economic indicators remain fairly robust. Fortunately, inflation has fallen considerably from its highs and mostly continued this downward trend in the third quarter. Core inflation has fallen all year and is now the lowest it has been since 2021, but headline inflation (which includes food and energy) rose to 3.7% in August, mainly due to the increase in the price of gasoline. With wage growth remaining in the 4% to 4.5% range and housing prices near or at all-time highs, it may take a while for core inflation to get down to the Fed’s 2% target absent a recession.
The third quarter was weak for stocks and bonds
For the first time since the third quarter of 2022, most stock indices were down in the quarter. The S&P 500 fell 3.6% and is now up just over 13% for the year. The Nasdaq index of technology stocks continues to be the big winner for the year with a 26% return, though it was down 3.9% during the third quarter. U.S. mid-cap and small-cap stocks, as well as foreign equities, have positive returns for the year but have underperformed U.S. large-cap stocks in 2023.
Major bond indices were also down as interest rates continued rising. U.S. bonds, as measured by the Bloomberg US Aggregate Bond Index, are on track for the third straight year of losses, something that would be unprecedented. As mentioned earlier, the 10-year Treasury yield rose almost 80 basis points in the quarter and is now at its highest level since 2007. Fixed-income securities that mature in less than three years have performed well this year as their yield has climbed above 5%, and they have less duration risk than intermediate-term, fixed-income securities.
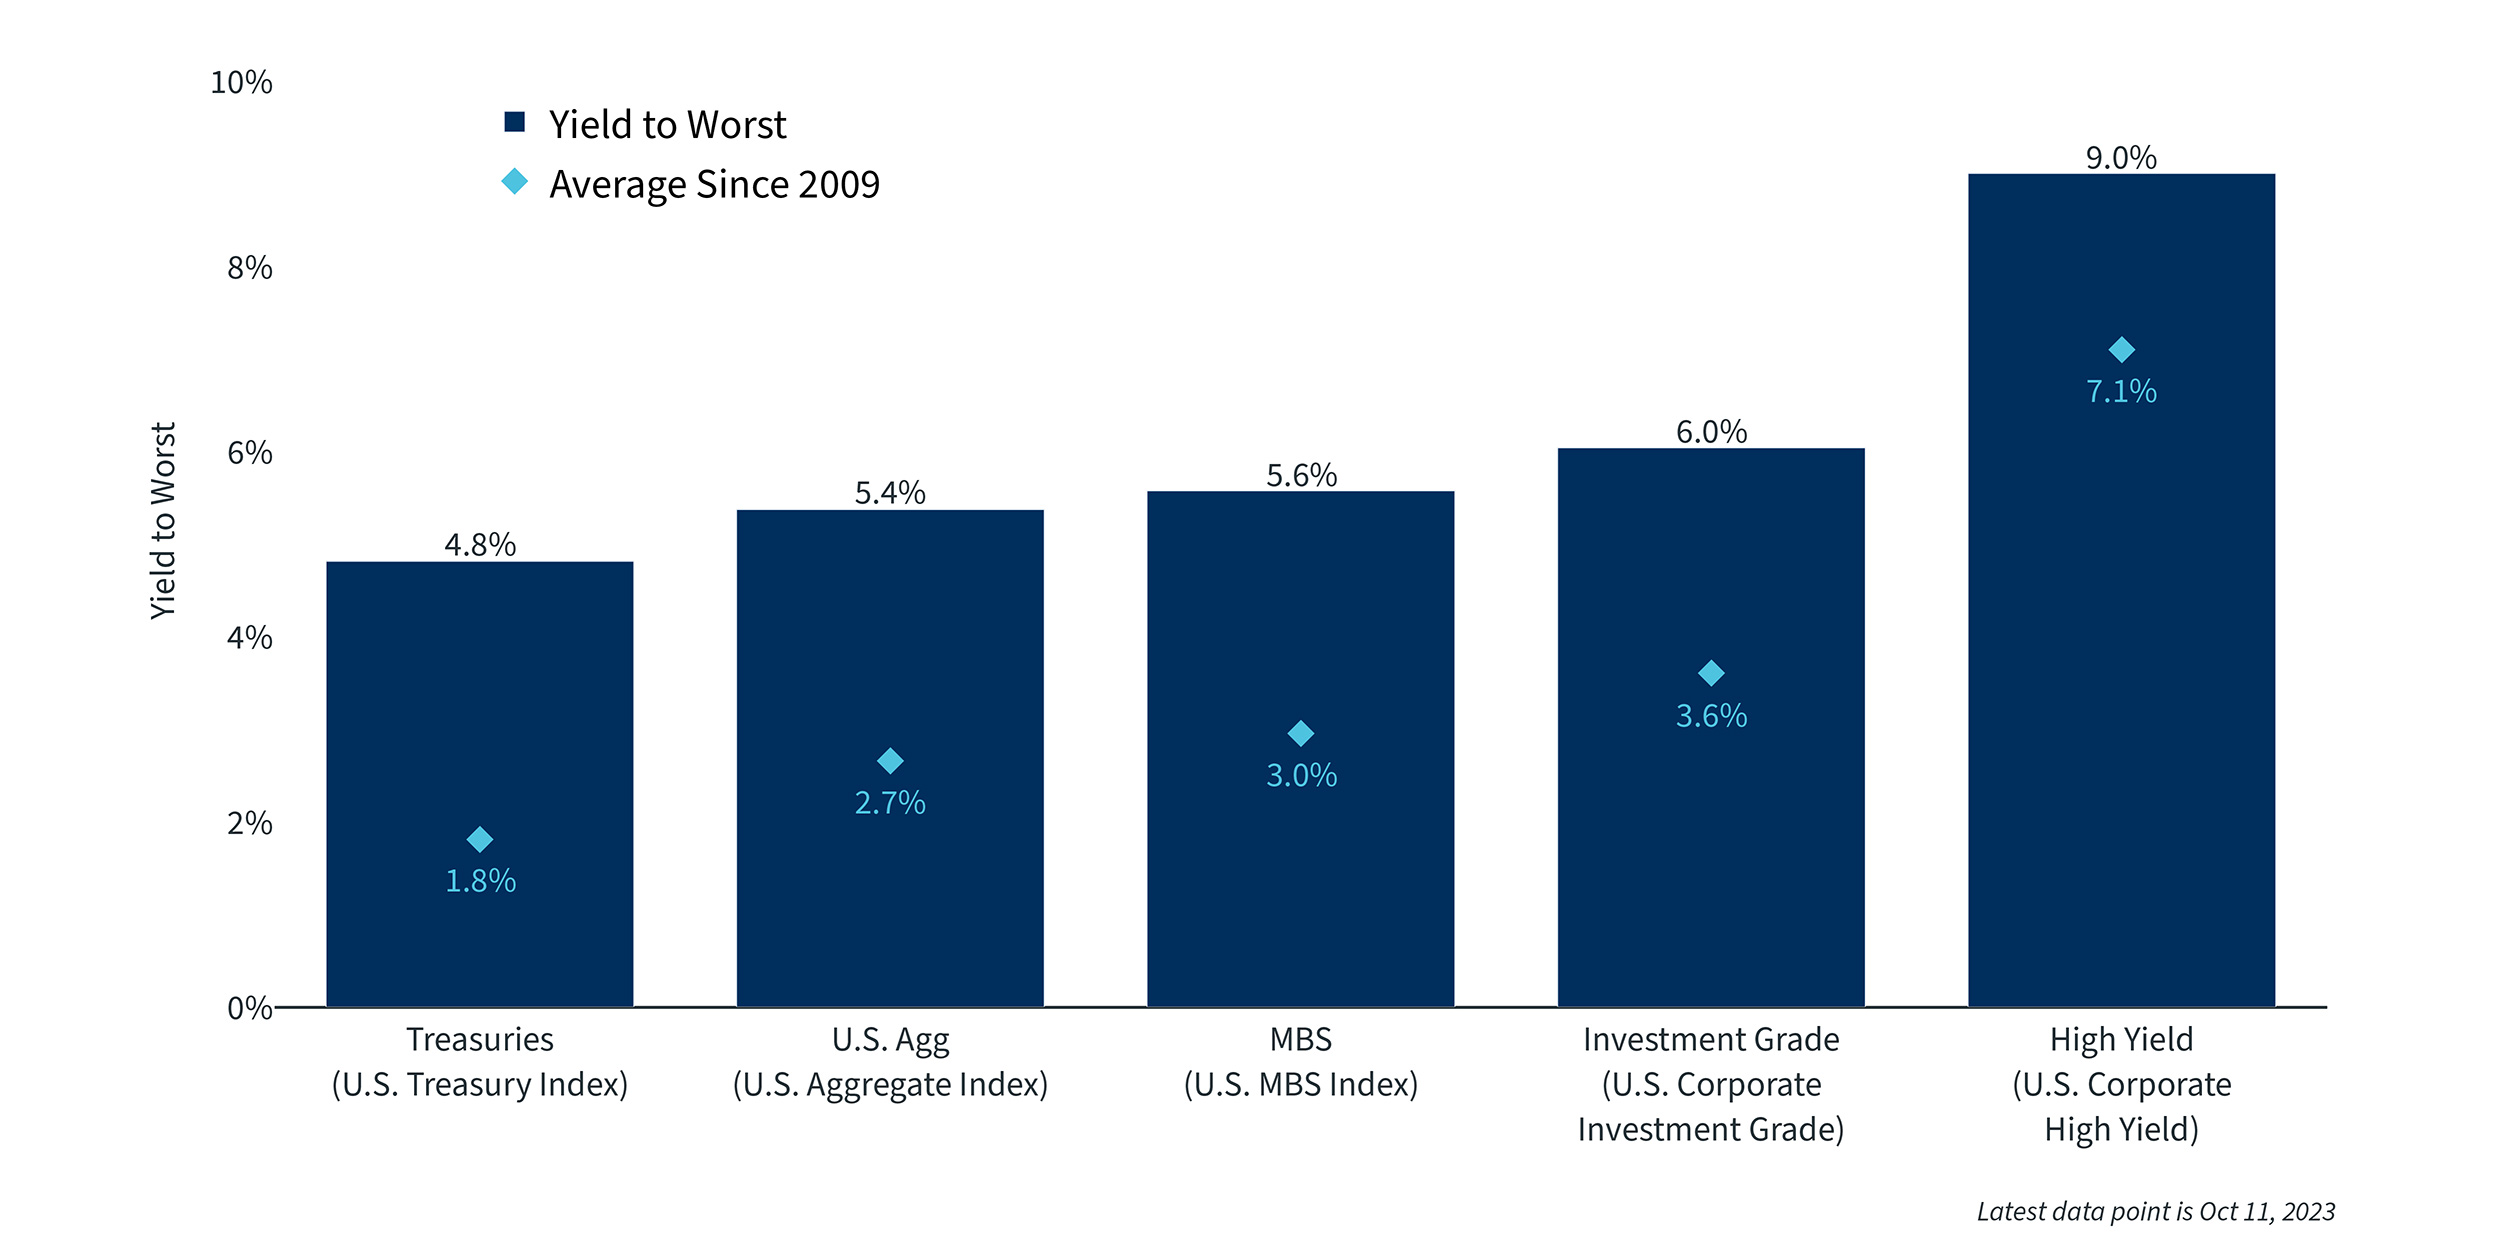
A positive outcome of the increase in yields is that income potential on investment-grade bonds is as high as it has been in many years. The current yield on the Aggregate bond index is roughly 5.5%, about double the average yield on the index since 2009.
Traditional Sources of Bond Yield4
Summary
There are a lot of risks to economic growth: A possible government shutdown in November, the restart of student loan repayments, geopolitical issues in Eastern Europe and the Middle East, prolonged strikes caused by disputes between unions and company management, and increased borrowing costs, just to name a few. On the positive side, labor markets continue to be strong, corporate earnings are rising and core inflation is much lower at this point in 2023 than it was in 2022, leading to real wage gains for the average U.S. worker. Equity valuations are more reasonable than they were three months ago, and fixed-income investors continue to enjoy attractive yields, even on very short duration investments like money market funds. Housing activity is very slow due to a lack of inventory, but new supply is being created. While it can be easy to get caught up in the latest headlines, most often the prudent course of action is to stick to a long-term investing plan and take actions that can lead to a better after-tax, risk-adjusted return. These steps include rebalancing your portfolio at regular intervals and using losses to offset capital gains incurred from selling securities. As a final step, review your financial plan on a regular basis to make sure your portfolio does not have more risk than you can handle, or less risk than you can afford to have to meet your long-term financial goals. Taking these actions can help you stay the course during periods of volatility and can lead to better outcomes over longer periods of time.
The views and opinions represented in this message are my own and do not necessarily reflect the perspective of Bremer Bank, its subsidiaries or affiliates, or its employees. This message is provided for information purposes only and nothing in it constitutes investment, legal, accounting or tax advice, or a recommendation to buy, sell or hold any security. No recommendation or advice is being given as to whether any investment or strategy is suitable for a particular investor.
"Treasury Yield Curve. The shape of the U.S. Treasury curve last year versus today." Sources: Clearnomics, Federal Reserve
"Mortgage Rates. 30-year Fixed Rate Mortgage.” Sources: Clearnomics, Freddie Mac
“Consumer Sentiment. University of Michigan Surveys of Consumers - Consumer Sentiment, Current Economic Conditions and Consumer Expectations.” Sources: Clearnomics, University of Michigan
“Traditional Sources of Bond Yield. Yield to worst and averages since 2009.” Sources: Clearnomics, Bloomberg
%20--%3e%3cg%3e%3cg%20id='Layer_1'%3e%3cpath%20class='cls-1'%20d='M63,35.91c.05,14.91-12.02,27.03-26.99,27.12-14.79.09-26.95-12.03-27.01-26.91-.06-15.01,11.91-27.11,26.87-27.16,14.95-.05,27.08,12,27.13,26.95ZM45.08,18.32c-2.37,0-4.6-.07-6.82.02-3.32.14-5.55,1.94-6.61,5-.51,1.46-.62,3.07-.75,4.63-.12,1.45-.03,2.91-.03,4.54h-6.14v6.98h6.16v16.82h7.5v-16.89c1.6,0,2.98.05,4.34-.03.4-.02,1.05-.36,1.11-.65.4-2.02.67-4.06,1.01-6.3h-6.51c0-1.55,0-2.92,0-4.29,0-2.53,1.12-3.72,3.67-3.83,1-.05,2,0,3.06,0v-5.97Z'/%3e%3c/g%3e%3c/g%3e%3c/svg%3e)
%20--%3e%3cg%3e%3cg%20id='Layer_1'%3e%3cpath%20class='cls-1'%20d='M63,36.15c-.07,14.97-12.18,26.99-27.11,26.89-14.9-.1-26.92-12.16-26.89-26.99.03-15.01,12.15-27.11,27.15-27.08,14.87.03,26.92,12.23,26.85,27.18ZM36.62,51c.03-.53.08-.98.08-1.42,0-3.11-.04-6.22.02-9.33.05-2.49,1.88-4.31,4.23-4.36,2.31-.05,3.92,1.63,4,4.27.06,1.88.02,3.77.02,5.66,0,1.72,0,3.43,0,5.17h6.01c0-5.04.18-9.98-.07-14.91-.16-3.17-3.26-5.57-6.55-5.78-2.85-.18-5.44.35-7.56,2.83-.08-1.07-.14-1.75-.19-2.46h-5.83v20.33h5.84ZM27.06,30.66h-5.99v20.32h5.99v-20.32ZM24.06,20.18c-2.03-.03-3.64,1.57-3.66,3.65-.02,2.14,1.45,3.73,3.52,3.78,2,.05,3.74-1.57,3.82-3.56.08-2.04-1.63-3.84-3.68-3.87Z'/%3e%3c/g%3e%3c/g%3e%3c/svg%3e)
%20--%3e%3cg%3e%3cg%20id='Layer_1'%3e%3cg%3e%3cpath%20class='cls-1'%20d='M35.95,9.01c14.89-.05,27.01,12,27.05,26.9.04,14.88-12.08,27.09-26.9,27.08-14.88,0-27.08-12.13-27.1-26.93-.02-14.85,12.08-27,26.95-27.05ZM36.02,18.76c-2.54,0-5.09-.01-7.63,0-5.58.03-9.63,4.08-9.65,9.64-.01,5.09-.02,10.18,0,15.27.02,5.3,3.98,9.46,9.28,9.57,5.34.11,10.69.11,16.03,0,5.31-.11,9.22-4.26,9.24-9.58.02-5.19.03-10.38,0-15.57-.04-5.2-4.12-9.25-9.33-9.31-2.65-.03-5.29,0-7.94,0Z'/%3e%3cpath%20class='cls-1'%20d='M50.22,36.02c0,2.54.02,5.09,0,7.63-.03,3.73-2.68,6.49-6.41,6.54-5.19.06-10.37.06-15.56,0-3.7-.04-6.42-2.81-6.45-6.52-.04-5.14-.04-10.27,0-15.41.03-3.64,2.72-6.38,6.36-6.42,5.24-.06,10.48-.06,15.71,0,3.67.04,6.31,2.75,6.35,6.41.03,2.59,0,5.19,0,7.78ZM36.1,26.6c-5.11-.05-9.38,4.12-9.43,9.2-.05,5.28,4.02,9.53,9.18,9.59,5.26.07,9.54-4.07,9.66-9.35.11-5.02-4.25-9.4-9.41-9.44ZM43.25,26.81c.02,1.05,1.05,2.03,2.08,1.99,1.07-.04,2.04-1.06,1.92-2.12-.12-1.15-.78-1.84-1.98-1.87-1.13-.03-2.05.89-2.02,1.99Z'/%3e%3cpath%20class='cls-1'%20d='M42.2,36.07c-.04,3.39-2.95,6.22-6.3,6.13-3.35-.09-6.06-2.89-6.05-6.23,0-3.28,2.86-6.13,6.15-6.14,3.36,0,6.24,2.89,6.2,6.24Z'/%3e%3c/g%3e%3c/g%3e%3c/g%3e%3c/svg%3e)
%20--%3e%3cg%3e%3cg%20id='Layer_1'%3e%3cg%3e%3cpath%20class='cls-1'%20d='M8.99,36.02c0-14.9,12.03-27.02,26.87-27.06,14.99-.03,27.2,12.17,27.15,27.13-.05,14.95-12.18,26.99-27.14,26.94-14.9-.05-26.87-12.08-26.87-27.02ZM36,48.01c4.01-.29,8.03-.5,12.03-.89,2.54-.25,3.77-1.45,4.16-3.94.75-4.76.75-9.54.02-14.3-.39-2.56-1.67-3.79-4.23-4.08-7.98-.91-15.96-.92-23.94,0-2.67.31-4.16,1.68-4.27,4.36-.18,4.57-.17,9.15,0,13.71.1,2.6,1.56,3.98,4.19,4.24,4,.4,8.01.6,12.04.89Z'/%3e%3cpath%20class='cls-1'%20d='M41.32,35.97c-2.91,1.7-5.64,3.29-8.55,4.98v-9.87c2.87,1.64,5.61,3.21,8.55,4.89Z'/%3e%3c/g%3e%3c/g%3e%3c/g%3e%3c/svg%3e)